The primary goal of the research is to determine how the emotional inclinations of investors affect the link between capital cost and systematic risk for businesses listed between 2014 and 2018 on the Tehran Stock Exchange. They work for themselves. The mood of investors is likewise erratic. There are 112 firms in the research's statistical sample. A descriptive-correlation study with an applied approach is the methodology used. The library technique was used to get the data for the theoretical foundations segment, and the financial document documenting method was used to gather the data for the hypothetical testing section. The multiple correlation and regression approach is typically used for hypothesis testing. As demonstrated by the findings, systemic risk and capital cost have a clear and substantial link, but this relationship is also weakened by investors' emotional biases. The financial leverage and the ratio of accruals to the cost of capital are directly and significantly correlated, according to the results of the control variables, and the size of the firm and the cost of capital are significantly correlated as well. The ratio of operational cash flows to capital costs was also not shown to be significantly correlated.
INTRODUCTION
Risk and return are included in the finance literature, which ultimately manifests as the cost of common stocks. The cost of common stock plays a fundamental role in financing decisions and common stocks and has always been one of the main concerns of common stockholders and financial decision-makers. The cost of common stock is an option that the company pays to finance the cost of its activities; in fact, it has used a loan, and the cost of common stock is the interest rate of that loan (Baahar Moghaddam & Hasanifard, 2010).
As the common stocks' investors enter the companies, the discussion about the cost of common stocks becomes more complicated. If a company uses only the financial resources that the investors provide, the cost of common stock is the same as the cost of selling the stock. These companies are managed by financing through selling the stocks or the amounts provided by the common stocks' investors as financial aid. In this case, the cost of common stock is the same as the cost of the loan and the cost of the stock. The combination of "loan financing" and "selling stocks for the company" forms the structure of the common stocks of that company (Khajavi & Alizadeh, 2017).
Problem Statement
The evidence indicates that common stock investors do not use only quantitative methods to determine the value of stocks. Judgments based on mental images and psychological and emotional conditions are also decision-making factors in the stock exchange. Emotional tendencies can be defined as "the tendency of the common stocks' investors for speculation" (Degan, 2016). According to this point of view, emotional tendencies have created comparative demand for the common stocks' speculative investors, which will have cross-level effects on the stock prices. Existing research on the emotional tendencies of common stocks' investors shows its role in evaluating the price of financial assets and its effect on returns on stocks. It is too difficult to determine the value of a stock because of information asymmetry; therefore, the common stocks' potential investors of the stock market judge the value of the company and measure it by the behavior of the company's investment in common stocks. When the common stock investors are optimistic about the company's future, they overestimate the value of the company's stocks and increase the stock price, which can affect other common stocks investors in the common stock market (Degan, 2016). The emotional tendencies of the common stocks' investors can play a great role in stock price movement, and asymmetric deviations affect the behavior of the investment decisions on common stocks in the real economy. The fake economy is a passive reflection of the real economy and can also affect the behavior of the common stock investors in the real economy.
The cost of resources used to finance a business is called the cost of common stock. The kind of funding that has been employed determines the price of common stock. For instance, the price of common stock only varies depending on the cost of shareholders' equity if a new company's initial expenditures are solely covered by its owners or founders. Now, the price of common stock will also depend on the cost of debt if the company's owners have raised a loan. The weighted average cost of common stock is a weighted average of all sources of common stock, and it is used to determine the overall cost of common stock for organizations that finance themselves using a combination of debt and equity. The common stock budgeting method heavily relies on the cost of common stock to decide whether the firm should proceed with the project or not, since it symbolizes the quorum rate that a company must surpass before creating value or initiating a new one (Alock et al., 2014).
On the other hand, systematic risk is a risk that affects the whole market, and it is not limited to one special company or industry. Systematic risk always exists and is irremovable and inevitable. One of the reasons for the occurrence and a large number of such risks is the weakness or change in governmental and foreign currency, commercial policies, etc. For example, war, currency fluctuations, economic sanctions, tariffs, inflation, etc., are some of the systematic risks that always affect the common stock market, the stock exchange, and the common stocks' investors (Chen et al., 2014).
The managers of companies try to reduce the effect of systematic risk on the cost of common stocks to increase their stocks' value. From the point of view of the common stocks' investors, the higher the quality and quantity of information published by the company, the lower the information asymmetry and the cost of the company's common stock, and therefore, the company's future performance perspective is better. In such a case, the investment in common stocks has more accurate estimates of the returns on the investments on common stocks, and fewer adjustments have occurred in the conducted estimates. This issue reduces the cost of the common stock of companies with high-quality information (Antoniou et al., 2015).
Increasing the systematic risk can result in increasing the cost of common stocks because the increase in the inflation and interest and currency rates leads to a decrease in sales and profitability and to an increase in the cost of raw materials, which ultimately increases the cost of common stock. However, it should be noted that in the case of increasing the systematic risk, increasing demands for buying the stock of a company is possible, and the common stocks' investors feel that they will profit or at least protect the value of their money by buying the company's stocks. This issue, which is related to the sentimental decisions of the common stocks' investors in risky conditions, can increase the price of stocks and profitability and reduce the cost of common stocks (Lam et al., 2018).
The conventional wisdom on return on equity holds that systematic shifts in the company's core values are the source of changes in stock price. Recent studies, however, indicate that the emotional disposition of investors is a significant factor in determining prices and explaining time series yields, particularly for equities whose values are extremely arbitrary and challenging to arbitrage (Nikbakht & Moghimi, 2014). Also, since financial management has affected improving the efficiency of organizations, improving their performance and profitability, and reducing systematic risk, it is one of the most important issues in the financial-behavioral area to pay attention to the discussion of the emotional tendencies of the common stocks' investors. (Mostafa Moghaddam, 2017). The behavioral-financial point of view shows that the investors of common stocks make decisions affected by their emotional tendencies, and also, the emotional tendencies of the common stocks' investors play an important role in determining returns and prices.
The evidence indicates a positive relationship between the emotional tendencies of the common stocks' investors with the cost of stocks and the return on stocks with a higher subjective evaluation. Thus, it is necessary to assess the behavioral conditions of stock market participants based on sentimental variables. In other words, except for the fundamental factors, the impact of the behavioral and sentimental factors of the common stocks' investors on the cost of stocks should also be considered. In addition, the effect of accounting variables such as return on assets, return on sales, the book value of assets to their market value, profit per stock, firm size on cost, and return on stocks; micro and macro behavioral variables also affect the cost and return on stocks. Therefore, this study measures the emotional tendencies of the common stocks' investors (the amount of optimism and pessimism of stockholders about a stock) and its effects on stock price and systematic risk. Given the foregoing information and the significance of common stock costs, the primary goal of this study is to respond to the following query: Does the correlation between systematic risk and common stock costs of Tehran Stock Exchange-listed companies change as a result of investors' emotional inclinations?
Significance of the Study
From both the business's and the investors' perspectives, the cost of common stock is what is required to protect the company's investors and the expected return on investment in common stock. A key factor in common stock budgeting, stock portfolio selection, and valuation is the cost of the stock. While the cost of debt is readily observable, the cost of common stock must be estimated because it is not apparent. Recently, researchers in financial and accounting sciences have used implicit estimates of the cost of common stocks as summary measures of risk (Nikbakht & Moghimi, 2014).
The cost of common stock can be defined as the predicted return on a company's stock in the common stock market. According to the fact that the predicted cost of common stocks is not visible, past realized stock returns have been used as an indirect measure of the predicted cost of common stock. However, some researchers have argued that realized stock returns are a parasite approximation of the predicted cost of common stock. It should be noted that stockholders provide their funds to the company in order to receive a profit relevant to the risk of the investment in common stocks. Stockholders endure the greatest risk compared to other providers of financial resources of economic units (Nourosh et al., 2009).
The significance of this study is that the traditional view of the market depends on the assumption that the only fundamental value of a company can affect its changes in prices, but recent research shows that behavioral tendencies are among the emotional tendencies of the common stocks' investors which has an effective and significant role in determining the price and also in explaining the returns of time series intervals (Mostafavi Moghaddam, 2017). The behavioral-financial views show that some of the changes in the price of securities have no fundamental reason, and the emotional tendencies of the common stocks' investors have an important role in determining the prices. Also, the increase of systematic risk can have different positive and negative effects on the companies; by explaining this issue, attracting common stock investors in the common stock market of our country is very important because the common stock market of our country is newly established compared to the developed countries according to the managers' opinion and in order to achieve this goal, identifying the relationship of factors such as systematic risk and emotional tendencies of the common stocks' investors and their influence on the cost of common stock can be helpful in achieving the ultimate goal of companies.
Research Background
Zarei and Darabi (2017) investigated the effect of the emotional tendencies of the common stock Investors regarding voluntary disclosure in Iran's common stock market-listed enterprises: since this study is causal in nature, it is both useful and ex post facto. Although there is no significant relationship between the emotional tendencies of investors in common stocks and voluntary disclosures when the emotional tendencies are classified as high or low, the results of hypothesis testing in 72 companies indicate a positive and significant relationship between the emotional tendencies of investors and voluntary disclosures. The study reveals a noteworthy correlation between the control variables of economic growth, firm size, return on assets, and the ratio of book value to market value with voluntary disclosures. Additionally, a significant negative correlation has been observed between the voluntary disclosure of a company and its fate.
In research, Zanjirdar and Litani (2017) investigated the effect of the emotional tendencies of the common stocks' investors and the amount of the company's borrowing on the deviation from the predicted common stocks in Iran. The research hypotheses in this study were analysed using linear regression and correlation, and the data were analysed and the research hypotheses were tested using Eviews software. To summarise and draw a broad conclusion from the research hypotheses tested, it can be stated that investors' emotional dispositions positively influence positive deviations of the companies' expected investments in common stocks and negatively influence negative deviations of those same companies' predicted investments in common stocks; also, the amount of borrowing has a positive effect on the positive deviations of the predicted common stocks' investment and a negative effect on the negative deviations of the predicted common stocks' investments of the companies. Finally, the results showed that the emotional tendencies of the common stocks' investors partially intensify the negative deviations of the predicted common stocks' investment by reducing the borrowing and the positive deviations of the predicted common stocks' investment.
The impact of voluntary disclosure on the pricing of common stock was examined by Khoddamipour and Mahroumi (2018) in their study, "The Effects of Disclosure Quality on the Cost of Common Stock," which covers 81 listed businesses on the Tehran Stock Exchange during a four-year period from 2013 to 2016. The findings demonstrate that voluntary disclosure has no discernible impact on the price of ordinary stocks. One important reason for this conclusion can be the inability of the common stocks' investors and other users of financial reports to use the disclosed accounting information.
Damouri et al. (2017) conducted research entitled "Investigating Overreaction of Investors to Patterns of Past Financial Performance Measures in the Tehran Stock Exchange." The statistical research methodology is through a panel data regression test. The overreaction of investors is an independent variable, and the abnormal return of the company's stocks is a dependent variable. Researchers examining the overreaction of shareholders have concluded that the investors of common stock overreact to the past financial performance of companies. The investors of common stock value stocks with good past performance are higher than their intrinsic value, and stocks with poor past financial performance are lower than their intrinsic value. After a while, when the investors of common stock realize that their previous expectations were not correct, the stock price will return to its intrinsic and real value. The results obtained indicate that the shareholders in the Tehran Stock Exchange overreact to the variables of income before extraordinary items, sales, and stock returns, but they do not overreact to the variable of cash flow.
The research "Investigating the Effects of Disclosure Quality on the Cost of Common Stock of the Companies Listed in the Tehran Stock Exchange" was carried out in 2016 by Khajavi and Alizadeh. This includes controlling the impact of business size, financial leverage, price, and trading volume of stocks. The Botosan checklist (1997), modified by Kashanipour et al. (2009), includes 71 indicators in six general sections: background information, historical results summary, key non-financial statistics, segment information, projected information, and management discussion and analysis. These are used to measure the variables of information disclosure quality. To evaluate research hypotheses, multivariate regression with panel data is used. The results of an analysis spanning 122 firms between 2008 and 2013 show that the Tehran Stock Exchange's common stock prices are not significantly impacted by the quality of information disclosed by these companies.
In their study "Investigating the Effects of Disclosure Quality on The Cost of Common Stock," Royayi and Ebrahimi (2017) examined the connections between the factors. They said that the body of research supports the idea that some businesses willingly reveal information, while others go above and above by disclosing ethical information to demonstrate their commitment to justice, equity, and the public's rights and interests. In order to encourage companies to disclose ethics voluntarily, it is therefore necessary to pinpoint the factors that influence this behaviour. In this study, the impact of information disclosure quality on the price of common stocks of Tehran Stock Exchange-listed companies has been investigated. Cross-sectional logistic regression with maximum likelihood was employed in this investigation. The study's findings demonstrate that the price of common stocks is significantly impacted in the opposite direction by the quality of information disclosure.
Sinai and Sadafi (2017) conducted research entitled "Evaluating the Investor's Reaction to Financial Performance of Firms." The statistical research methodology is conducted through stepwise regression. One independent variable is the investors' response, while the company's financial success is the dependent variable. Using a behavioral-financial theory approach, researchers have examined the behaviour of securities traders and investment institution management. Their findings suggest that investors tend to overreact to the historical performance of firms and often make poor selections. In three phases, this study explores the above-mentioned problem of utilising winner and loser portfolios. The outcomes demonstrated that traders and management of investment institutions on the Tehran Stock Exchange overreact to indicators related to sales, net profit, cash flow, and return on stock.
In 2017, Masoudi and Moeinaddin carried out a study titled "Examining the Impact of Growth Prospects on the Price of Common Stocks on the Tehran Stock Exchange." Using systematic elimination sampling, 160 firms whose data needed for the nine-year study period (2006–2014) was available from the statistical population (companies listed on the Tehran Stock Exchange) were chosen for this purpose. The statistical method of multivariate regression with panel data has been applied in order to assess the study hypothesis. According to the study's findings, growth prospects significantly and in the opposite direction affect the price of a company's common stock.
Nouraty et al. (2019) conducted research in Malaysia on the relationship between the company members of directors and the audit committee and the cost of common stock in Malaysian companies that are offering their stocks on the stock exchange for the first time. The results of the research indicated that the companies in which there are more dormant members of directors and also have a larger audit committee have a lower cost of common stock.
The impact of investors' emotional inclinations on the correlation between systematic risk and the common stock price was examined by Lam et al. (2018). Multiple regression and correlation are used in the hypothesis testing process. The study's findings demonstrated that systematic risk and common stock price have a clear and substantial link and that this relationship is further weakened by the investors' emotional inclinations. The findings concerning the control variables indicated that there is a significant and direct correlation between the ratio of accrual items to the cost of common stock and financial leverage. Additionally, there is a significant and inverse relationship between a company's firm size and the cost of common stock. Furthermore, there was no discernible correlation between the cost of common shares and the operational cash flow ratio.
Hou et al. (2019) investigated the effect of the emotional tendencies of the common stocks' investors and accounting information on stock price based on the residual income evaluation model. In the current research, using the data of Beijing Stock Exchange companies during a 6-year period (2012-2017), the emotional tendency index of the common stocks' investors was obtained, and the effect of the emotional tendencies of the common stocks' investors on the perspective of expected earnings growth and the expected rate of return has been studied. In addition, the mutual effect of the emotional tendencies of the common stocks' investors and accounting information on stock prices has been studied by the correlation method. The empirical results of the current research show that the emotional tendency index of the common stocks' investors changes the expected earnings growth and then affects the stock price. However, the emotional tendency index of the common stocks' investors has no significant effect on the expected rate of return. Also, the conflict between accounting information and the emotional tendency index of the common stocks' investors explains the stock price in high volatility of earnings.
Shellifer and Vishni (2018) investigated the relationship between the quality of disclosure and the cost of common stock among 684 companies from 2000 to 2014 on the Bangladesh Stock Exchange. He concluded that the quality of disclosure has a significant and reverse effect on the cost of common stocks of companies. However, he believes that this result may not be the same in other countries because there is a significant difference between the Bangladeshi market and other economies.
In a research, Chan (2017) studied the relationship between the emotional tendencies of the common stock investors, corporate governance, and decisions on the investment of common stock in the Beijing Stock Exchange. The emotional tendencies of the common stocks' investors and corporate governance are independent variables, and decisions regarding investment in common stocks are dependent variables. The statistical research methodology is the logistic regression test. In this research, despite the reverse effect of the emotional tendencies of the common stocks' investors on the decisions to invest in common stocks, if it exists, the issue is discussed that this effect is influenced by the mechanisms of corporate governance. The samples used in this research include the companies in Taiwan from 2003 to 2010. The empirical results show that the emotional tendencies of the common stocks' investors are significantly and positively related to the number of new investments in common stocks and excessive investments in common stocks. Also, corporate governance has a supervisory and motivational effect on decisions. According to agency problems, managers' decision-making is influenced by the emotional tendencies of the common stocks' investors and deviates from the goal of maximizing the company's value. Therefore, companies should strengthen their corporate governance mechanisms in order to minimize the reserve effect of the emotional tendencies of the common stock investors.
Zureigat (2017) investigated the ownership structure and cost of common stocks in the Jordan Stock Exchange research. He considered three indicators for ownership structure: institutional ownership, foreign ownership, and the concentration of ownership. He found that companies with foreign stockholders and institutional stockholders have a significant positive relationship with the cost of common stock by studying 198 companies listed in the Jordanian stock market. In contrast, the concentration of ownership has a negative relationship with the cost of common stock.
A 2017 study by Behn et al. examined the connection between systematic risk, common stock price, and the company's auditing calibre on the New York Stock Exchange. American businesses from the 2007–2015 five-year period make up the statistical sample used in this study. The research findings demonstrated a negative correlation between systematic risk and auditing quality as well as a reverse association between systematic risk and the price of a company's common stock.
Hypotheses, Model, and Variables of Research
In this research, systematic risk is the independent variable, and the cost of common stock is the dependent variable. The emotional tendencies of the common stocks' investors are also an adjusting variable. Financial leverage, firm size, accrual items ratio, and operating cash flow ratio variables are also considered control variables. The regression models of hypothesis testing are as follows:
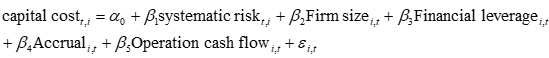 |
(1) |
 |
(2) |
The sensitivity coefficient (β) of the organization has been utilized to assess the systemic risk of the organization. Put simply, the rate of return that a stockholder should anticipate earning is determined by the systematic risk of that particular asset. According to Raeisian and Asghari (2017), the beta coefficient (β) may be calculated by dividing the variance of the market securities portfolio by the covariance of the stock return with that of the portfolio.
|
Β=COV(RS, R,N)/VARN |
(3) |
B = Systematic risk, COV (RS, R, N) = covariance of the returns on the stock with the returns on the market securities portfolio, VARN = variance of the market securities portfolio
In this research, Gordon's model is used to calculate the cost of common stock, which is as follows (Rezazadeh & Garousi, 2011):
|
|
(4) |
In the above formula, P0 is the stock price before the previous year's general meeting, and D2 is equal to the dividend in the intended year. To calculate the growth rate, first, the earnings before tax of the companies are considered, and according to the tax rate, tax adjustment is applied to them. In this way, primary information was provided to calculate the compound growth rate of each company. The compound growth rate of each company was calculated according to the following formula:
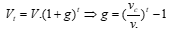 |
(5) |
In the above equation, V0 is equal to the earnings after tax of year t, and Vt is equal to the earnings after tax of year t-5.
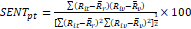
In this study, the emotional tendencies index of the common stock market (EMSI) was used to measure the emotional tendencies of the common stocks' investors. This index was developed by Jones (2005) and by adjusting the model of Persavd (1996). Therefore, the emotional tendencies of the common stocks' investors can be calculated using the following equation (Heidari & Bashiri, 2012):
|
|
(6) |
Where Rit = monthly return rate of the i's stocks of the company in month t, Riv = the historical volatility rate of the company i in month t
To calculate the historical volatility, the average standard deviation of returns on the stock for five months is used.
Rr = monthly average of return rate on stocks of sample companies, Rv = average of historical volatility rate of stocks of sample companies (Heidari & Bashiri, 2012).
Financial Leverage
In this study, the financial leverage of the company is measured by dividing the book value of long-term liabilities by total assets (Raeisian & Asghari, 2017).
|
FL=BV/TOTL ASSETS |
(7) |
BV= the book value of long-term liabilities
Firm Size
The firm size is calculated in different ways, like assets that are calculated by assets in this research. It means that the Napierian logarithm of total assets is the criterion for evaluating the firm size (Mojtahedzade & Aghaei, 2010).
Firm size = log (total assets)
Accrual Item Ratio
Total accrual items (TAi,t) are obtained from the difference between earnings before extraordinary items (EARNi,t) and cash flows from operating activities (CFOi,t). Total accrual items divided by total assets show the ratio of accrual items (Hassas Yegane et al., 2014).
Operating Cash Flows
The following formula is used to calculate the operating cash flow (Raeisian & Asghari, 2017):
|
CFO = NI + NCC + ∆WC |
(8) |
where: NI is the net income, and NCC is the non-cash charges that should be added to the net income; because these types of charges (expenses) have reduced the net income, but no cash has been spent on it, such as depreciation ∆WC = changes in working common stock.
Statistical Population and Sample
This study's statistical population consists of all 497 businesses that were registered on the Tehran Stock Exchange as of March 20, 2019.
The sample firms in this study were chosen from the target statistical population based on the following criteria and restrictions: the systematic elimination sampling procedure (screening):
By applying the above conditions, 112 companies were selected as the research sample in this research.
Data Analysis
Descriptive Statistics of Research Variables
Table 1. Descriptive Statistics of Research Variables.
|
Variable |
Number of observations |
Average |
Standard deviation |
Minimum value |
Maximum value |
Skewness |
Kurtosis |
|
The cost of common stock |
560 |
0.2549 |
0.1672 |
0.0109 |
0.5159 |
3.123 |
4.890 |
|
Emotional tendencies of the investors of common stock |
560 |
0.2637 |
0.2411 |
-0.3253 |
0.7932 |
0.666 |
5.5531 |
|
Systematic risk |
560 |
0.2154 |
0.1252 |
0.0452 |
0.6919 |
2.003 |
7.212 |
|
Firm size |
560 |
12.1218 |
0.0536 |
9.5107 |
17.2965 |
4.002 |
3.211 |
|
Accrual item ratio |
560 |
0.2956 |
0.0419 |
0.225 |
0.476 |
2.593 |
1.177 |
|
Financial leverage |
560 |
0.5924 |
0.1304 |
0.3316 |
0.6482 |
2.337 |
2.172 |
|
Operating cash flow ratio |
560 |
0.3009 |
0.1869 |
0.0868 |
0.6614 |
4.376 |
3.219 |
Based on the provided data on Table 1, the sample firms' average cost of common stocks is 0.2549, with the lowest and largest values being 0.0109 and 0.5159, respectively. It is determined that this variable does not have a normal distribution by evaluating its skewness and kurtosis, which should be 0 and 3, respectively, indicating that the variable has a normal distribution. Firm size is associated with the greatest average, while systematic risk is associated with the lowest average, as shown in Table 1, which provide the descriptive statistics of research variables. Emotional inclinations of investors in common stocks are associated with the largest standard deviation, whereas the accrual item ratio is associated with the lowest standard deviation.
The Normality Test of the Distribution of Dependent Variable of Study
Table 2. The normality test of the dependent variable of the study and results of the normality test of the dependent variable after the data normalization process.
|
Subject |
Variable |
Number (N) |
Statistic (K-S) |
Significance (Sig) |
|
normality test of the dependent variable of the study |
The cost of common stock |
560 |
4.616 |
0.000 |
|
normality test of the dependent variable after the data normalization process |
The cost of common stock |
560 |
0.670 |
0.761 |
The cost of common stock variable does not have a normal distribution, as evidenced by the fact that the significance level of the K-S statistic for this variable is less than 0.05. As a result, the hypothesis H0, which states that the distribution of these variables is normal, is rejected at the 95% confidence level.
Normalizing the dependent variable is a prerequisite for using regression models; hence, it must be normalized before the hypotheses are tested. Minitab 16 software was utilized to analyses the data in this study after it had been normalized using the Johnson Transformation function. The following graphic describes the K-S test findings following the data normalization procedure.
Table 2 shows that the dependent variable's significance level (Sig.) for the Kolmogorov-Smirnov statistic after normalization is greater than 0.05 (0.761), indicating that the hypothesis is accepted at the 95% confidence level and that the cost of the common stock variable has a normal distribution following the normalization process. On the other hand, because the number of sections in your time tends to be infinite, the variables can be defined as normal, and this causes no problems in the estimation process of the model.
Investigating Correlation Between Research Variables
The findings of Pearson's correlation test show that the variables of investors' emotional inclinations and company size with respect to the price of common stocks have a substantial and inverse relationship. The accrual items ratio, financial leverage, and systemic risk all have a strong and direct relationship with the price of common stock. Furthermore, according to Table 3, no meaningful relationship was seen between the cost of common shares and the operational cash flow ratio.
Table 3. The Pearson correlation test.
|
Variable |
The cost of common stock |
Emotional tendencies of the investors of common stock |
Systematic risk |
Firm size |
Accrual item ratio |
Financial leverage |
Operating cash flow ratio |
|
The cost of common stock |
1 |
-0.176 |
0.385 |
-0.489 |
0.336 |
0.188 |
0.291 |
|
Emotional tendencies of the investors of common stock |
|
1 |
0.238 Sig(563) |
0.410 Sig(338) |
0.012 Sig(018) |
0.332 Sig(199) |
0.164 Sig(083) |
|
Systematic risk |
|
|
1 |
0.583 Sig(225) |
0.428 Sig(153) |
0.117 Sig(115) |
0.003 Sig(034) |
|
Firm size |
|
|
|
1 |
0.238 Sig(063) |
0.478 Sig(173) |
0.319 Sig(216) |
|
Accrual item ratio |
|
|
|
|
1 |
0.511 Sig(229) |
0.011 Sig(042) |
|
Financial leverage |
|
|
|
|
|
1 |
0.240 Sig(095) |
|
Operating cash flow ratio |
|
|
|
|
|
|
1 |
The Results of Research's Hypotheses Testing
Table 4. The result of the Hausman and Chow Test for the first model and Second model
|
Model type |
Test |
Number |
Statistic |
Statistic value |
Freedom degree |
P-Value |
|
first model |
Chow |
560 |
F |
3.0932 |
6 |
0.0284 |
|
Hausman |
560 |
X2 |
3.0705 |
6 |
0.0394 |
|
|
second model |
Chow |
560 |
F |
4.1793 |
6 |
0.0054 |
|
Hausman |
560 |
X2 |
3.326 |
6 |
0.0215 |
The test's hypothesis H0 is rejected at a 95% confidence level based on the findings of Chow's test and its P-value, as shown in Table 4, the result of the Hausman and Chow Test for the first model and Second model, suggesting that the panel data approach may be applied.
Moreover, the hypothesis is accepted, and the test's hypothesis H0 is rejected at the 95% confidence level based on the Hausman test findings and its P-value, which is less than 0.05. For this reason, the fixed effect technique must be used to estimate the model.
Aside from verifying that there is no collinearity between the independent variables included in the model, tests pertaining to the residuals' normality, homogeneity of variances, independence, and lack of model specification error (linearity) can also be carried out in order to examine the acceptability of the model and the assumptions of classical regression.
The homogeneity of residual variance is another statistical presumption of classical regression. The linear estimator will be impartial and will not have the least variance if the variances are diverse. The homogeneity of variances in this study was examined using the Breusch-Pagan test. The null hypothesis about the homogeneity of variance is accepted based on the significance of this test, which is greater than 0.05, indicating that the model does not have the heterogeneity of variance problem (Table 5).
Table 5. The results of tests related to statistical assumptions for the first model and second model.
|
Model type |
Jarque-Bera statistic |
Breusch-Pagan statistic |
Ramsey statistic |
|||
|
First Model |
X2 |
P-Value |
F |
P-Value |
F |
P-Value |
|
1.3435 |
0.3412 |
1.0845 |
0.1302 |
3.4722 |
0.6238 |
|
|
Second Model |
X2 |
P-Value |
F |
P-Value |
F |
P-Value |
|
1.1045 |
0.7325 |
1.835 |
0.1042 |
5.0326 |
0.0943 |
|
The study model is estimated using the panel data approach and as fixed effects in accordance with the findings of the Chow and Hausman tests as well as the results of the classical regression statistical assumptions test.
Testing of the First Hypothesis
Table 6. The results derived from the multivariate regression of the first hypothesis.
|
Variable type |
Symbol |
Variable name |
Coefficient |
Statistic t |
Significance |
|
Dependent variable |
Y |
The cost of common stock |
- |
- |
- |
|
Constant |
α |
Alpha |
-1.744 |
-2.648 |
0.025 |
|
Independent variable |
X1 |
Systematic risk |
0.440* |
2.788 |
0.001 |
|
Control variables |
Firm size |
-0.627* |
-2.995 |
0.025 |
|
|
Financial leverage |
0.722* |
2.904 |
0.000 |
||
|
Accrual item ratio |
0.587* |
2.854 |
0.009 |
||
|
Operating cash flow ratio |
0.627 |
1.795 |
0.101 |
||
|
|
Watson camera |
1.856 |
- |
- |
|
|
|
Statistic F |
3.742 |
- |
0.000 |
|
|
R Square |
coefficient of determination |
0.397 |
- |
- |
|
|
Adjusted R Square |
The adjusted coefficient of determination |
0.396 |
- |
- |
|
*: the significance is equal to 0.05.
As Table 6 illustrates, there is a significant relationship between the variables of systematic risk, firm size, financial leverage, and the accrual items ratio (p-value<5%) with the cost of common stock, and the operating cash flows ratio has no significant relationship with the cost of common stock of the company. The coefficient of variables shows that the relationship between financial leverage and the cost of common stock is higher than other variables.
There is a direct and significant relationship between the variables of systematic risk, financial leverage, and accrual items ratio with the cost of the company's common stock, and the relationship between the variable of firm size and the cost of the company's common stock is reversed and significant.
The positive coefficient of the systematic risk variable (0.440) indicates a direct relationship between systematic risk and the cost of common stock of companies; so by increasing 1 unit of systematic risk, the cost of common stock also increases by 0.440 units. Therefore, according to the analysis related to admitting the first hypothesis of the research, it can be concluded that there is a direct and significant relationship between the systematic risk and the cost of the company's common stock.
According to this issue, the significance of the F statistic is less than 0.05 (0.000), so the fitted (calculated) regression model is significant, and according to the adjusted coefficient of determination, these variables explain 19.6% of the changes in the cost of the company's common stock.
Testing of the Second Hypothesis
Table 7. The results derived from the multivariate regression of the second hypothesis.
|
Variable type |
Symbol |
Variable name |
Coefficient |
Statistic t |
Significance |
|
Dependent variable |
Y |
The cost of common stock |
- |
- |
- |
|
Constant |
α |
Alpha |
0.765 |
2.944 |
0.002 |
|
Independent variable |
X1 |
Systematic risk |
0.157* |
2.731 |
0.001 |
|
Adjusted variable |
X2 |
Emotional tendencies*systematic risk |
-0.436 |
-2.781 |
0.000 |
|
Control variables |
Financial leverage |
0.628* |
2.034 |
0.001 |
|
|
Firm size |
-0.118 |
-2.775 |
0.009 |
||
|
Accrual item ratio |
0.538* |
2.825 |
0.032 |
||
|
|
Operating cash flow ratio |
0.318 |
0.936 |
0.143 |
|
|
Watson camera |
1.775 |
- |
- |
||
|
|
Statistic F |
14.002 |
- |
0.003 |
|
|
R |
coefficient of correlation |
0.523 |
- |
- |
|
|
R Square |
coefficient of determination |
0.273 |
- |
- |
|
|
Adjusted R Square |
The adjusted coefficient of determination |
0.271 |
- |
- |
|
*: the significance is equal to 0.05.
As Table 7 shows, there is a significant relationship between systematic risk, emotional tendencies of the common stocks' investors, financial leverage, firm size, and accrual items ratio variables (p-value<5%) with the cost of common stocks, and between operating cash flow, the ratio has no significant relationship with the cost of common stock. The coefficient of variables shows that the relationship between financial leverage and the cost of common stock is higher than other variables.
The variables of emotional tendencies of the common stocks' investors and firm size have a reverse and significant relationship with the cost of common stock of the company, and the variables of systematic risk, financial leverage, and accrual items ratio have a direct and significant relationship with the cost of common stocks of the company.
The positive coefficient of the systematic risk variable (0.157) indicates a direct relationship between systematic risk and the cost of common stock of companies; so by increasing 1 unit of systematic risk, the cost of common stock also increases by 0.157 units.
By comparing the systematic risk variable coefficients in Tables 6 and 7, the second hypothesis is accepted, and it can be concluded that the emotional tendencies of the common stocks' investors reduce the correlation between systematic risk and the cost of common stocks.
Considering that the significance level of statistic F is less than 0.05 (0.003), the fitted (calculated) regression model is significant, and according to the adjusted coefficient of determination, these variables explain 27.1% of the changes in the cost of the common stock of the company.
Results of Test Related to Control Variables
In investigating the significance of the coefficients according to the provided results, since the probability of the statistic t for the coefficients of firm size, financial leverage, and accrual items ratio variables are smaller than 0.05, the significant relationship between firm size, financial leverage, and accrual items ratio with the cost of common stock of the companies is accepted at the confidence level of 95%.
The negative coefficient of the firm size variable indicates the reverse relationship between firm size and the cost of common stocks of the companies, and the positive coefficient of financial leverage and accrual items ratio variable indicates a direct relationship between financial leverage and accrual items ratio with the cost of common stocks. There is no significant relationship between the operating cash flow ratio and the cost of common stock.
RESULTS AND DISCUSSION
The cost of common stocks depends on the type of financing. For example, if the startup costs of a new business are financed only by its owners or founders, the cost of common stock depends only on the cost of stockholders' equity. If the owners of the company have raised a loan, the cost of common stock will also depend on the cost of debt. Many companies use a combination of debt and stockholders' equity to finance, and for such companies, their total cost of common stock is derived from a weighted average of all sources of common stock, which is known as the weighted average cost of common stock. Since the cost of the common stock shows the quorum rate that a company must overcome before generating value or starting a new project, it is greatly used in the common stock budgeting process to determine whether the company should continue the project (Alock et al., 2014).
The important findings of this research can be stated as follows.
According to the results of the first hypothesis of the research, there is a direct and significant relationship between systematic risk and the cost of common stocks of the companies listed on the Tehran Stock Exchange from 2013 to 2017, and this result mentions the fact that as systematic risk increases, the cost of common stocks of the company increases.
In financial and economic knowledge, systematic risk is a risk caused by general market factors, which simultaneously affect the total price of securities in the financial market. Factors that cause this type of risk include economic, political, and social changes such as exchange rate fluctuation, business cycles, and government fiscal and monetary policies. Systematic or unavoidable risk is not limited to one or more companies, but it is related to the entire market, and among the factors influencing it, we can mention macro government policies, exchange rate fluctuation, inflation, business cycles, etc. It is also called irreducible or unavoidable risk because of the fact that such a risk is related to the general state of the market and its fluctuations and cannot be reduced in a portfolio of securities that is appropriately varied.
Increasing systematic risk will cause instability in the common stock market; in the last 5 years, increasing systematic risk has led to an increase in inflation, exchange rate, and the cost of companies' common stocks.
The results of this section are consistent with the research of Yhon and Peng (2011) and Vishvanatan (2012) and are not consistent with the results of the research of Thomas Jeanjean (2014), Aghaei and Chalaki (2013), Moradzadeh Fard and Hosseini (2014) and Moradi (2014).
According to the results of the second research hypothesis, the emotional tendencies of the common stock investors reduce the relationship between systematic risk and the cost of common stock of companies listed on the Tehran Stock Exchange.
The boundary between optimism and pessimism of stockholders towards a stock is called the emotional tendencies of the common stocks' investors. Emotional tendencies of the common stock investors increase the stock liquidity and increase the stock turnover. An increase in demand for company stocks increases the stock price and the profitability of companies, which covers a part of the costs of the company because of an increase in systematic risk.
The results of this research are consistent with the research of Shellifer and Vishni (2015) and are not consistent with the results of the research of Moradzadeh Fard and Hosseini (2014) and Moradi (2014).
The results related to control variables showed:
Increasing financial leverage increases the company's cost of common stocks. Financial leverage indicates the bankruptcy risk of the company. When financial leverage increases, the company intends to settle debts and can capitalize less on the investment growth in common stock. According to the research of Chen et al. )2014), decreasing the profitability of companies can increase the company's cost of common stocks.
Firm size is inverse to the cost of common stock because larger companies have more assets and common stock and employ more experienced financial managers. This issue increases the financial performance of the companies, and higher profitability reduces the company's cost of common stock.
The accrual items ratio directly relates to the company's cost of common stock because companies with a higher accrual items ratio have a higher probability of earning management, and earning manipulation is higher in them, which reduces the quality of financial reporting. Decreasing the quality of financial reporting reduces the accuracy of managers' predictions and leads to company managers making wrong decisions. This will eventually lead to the loss of the company and increase the company's cost of common stock.
Research Suggestions
According to the results of the first hypothesis based on the direct and significant relationship between systematic risk and the cost of common stock, it is suggested to the board of directors of companies to increase the liquidity of the company for safety stock because changes in systematic risk can lead to the bankruptcy of the company, but the improvement of the company's situation in terms of liquidity or assets which have high liquidity can prevent bankruptcy, company losses and reduce the cost of common stock.
Based on the results of the second hypothesis that the emotional tendencies of the common stocks' investors reduce the relationship between systematic risk and the cost of common stocks, it is suggested to the managers and decision-makers of the company to improve the quality of financial reporting, by implementing the optimal policy of profit sharing and on time information disclosure, make the common stocks' investors trust them, which increases the demand and tendency of the common stocks' investors to invest on the company's stocks, and ultimately increases the price of the company's stocks and reduces the company's cost of common stocks. Also, when the market conditions are such that the demand for the company's stocks increases, try to issue stocks because, at this time, the stock prices of the companies increase, and issuing stocks can be beneficial for the company due to the tendency of the stockholders to invest on common stocks.
CONCLUSION
As previously mentioned, increasing financial leverage increases the company's cost of common stocks. Financial leverage indicates the bankruptcy risk of the company. When financial leverage increases, the company intends to settle debts and can capitalize less on the investment growth in common stock. According to the research of Chen et al. )2014), decreasing the profitability of companies can increase the company's cost of common stocks.
Firm size is inverse to the cost of common stock because larger companies have more assets and common stock and employ more experienced financial managers. This issue increases the financial performance of the companies, and higher profitability reduces the company's cost of common stock.
The accrual items ratio directly relates to the company's cost of common stock because companies with a higher accrual items ratio have a higher probability of earning management, and earning manipulation is higher in them, which reduces the quality of financial reporting. Decreasing the quality of financial reporting reduces the accuracy of managers' predictions and leads to company managers making wrong decisions. This will eventually lead to the loss of the company and increase the company's cost of common stock.
ACKNOWLEDGMENTS: Thanks to Dr. Khoeini and Dr. Yousefvand who helped me in writing this article.
CONFLICT OF INTEREST: None
FINANCIAL SUPPORT: None
ETHICS STATEMENT: None
Aghaei, M. A., & Chalaki, P. (2013). Investigating the relationship between disclosure quality and the cost of common stock of the companies listed in Tehran stock exchange. Accounting Research Journal, 4, 54-77.
Alock, D., Karslow, A., Nahie, K., & Faloteh, B. (2014). The effectiveness of corporate governance and audit quality as monitoring devices of earnings management [PhD Dissertation]. The State University of New Jersey.
Antoniou, A., Guney, Y. & Paudyal, K. (2015). The determinants of capital structure: Capital market-oriented versus bank-oriented institutions. Journal of Financial and Quantitative Analysis, 43(1), 59-92.
Bahar Moghaddam, M., & Hasanifard, H. (2010). Investigating the relationship between systematic risk and disclosure quality in the companies listed in Tehran stock exchange. Accounting Research Journal, 6, 136-161.
Chen, B., Lorginsoun, J., Carter, M., & Gerakos, J. (2014). Institutional investor preferences for corporate governance, mechanism. working paper, University of Pennsylvania, The Wharton School, Boston College, Carroll School of Management and University of Chicago, Graduate School of Business.
Degan, P. S. (2016). On the association between institutional ownership and aggressive corporate earnings management in Australia. The British Accounting Review, 35, 105-137.
Hassas Yegane, Y., Sheri, S., & Khosronejad, H. (2014). The relationship between corporate governance mechanisms, debt ratio and firm size with the cost of common stock. Accounting Studies Journal, 24, 79-99.
Heidari, H., & Bashiri, S. (2012). The relationship between real exchange rate uncertainty and stock price index in Tehran stock exchange: Observations based on GARCH-VAR model. Journal of Economic Modeling Research, 3(9), 71-93.
Khajavi, Sh., & Alizadeh, V. (2017). Investigating the effects of the emotional tendencies of the common stocks' investors on the growth opportunities of companies listed in Tehran stock exchange. Accounting Research Journal, 4, 54-77.
Lam, S. S., Zhang, H., & Zhang, W. (2018). Does policy instability matter for international equity markets? International Review of Finance, 20(1), 155-196.
Mojtahedzadeh, V., & Aghaei, P. (2010). Factors affecting the quality of independent auditing from the perspective of independent auditors and users. Accounting and Auditing Journal, 11(4).
Mostafavi Moghadam, S. (2017). Explaining the pattern of the cost of common stocks of companies listed in Tehran stock exchange. Journal of Financial Research, University of Tehran, 16.
Nikbakht, M., & Moghimi, A. A. (2014). Investigating the relationship between economic value added and the cost of common stocks. Hesabras Magazine, 56.
Norosh, I., Nazemi, A., & Heidari, M. (2009). Disclosure and earning quality with emphasis on the role of accrual items estimation error. Accounting and Auditing Reviews, 43, 135-160.
Raeisian, A., & Asghari, J. (2017). Investigating the relationship between systematic risk and economic value added (EVA) in Tehran stock exchange. Mofid Economic Journal, 13(60), 61-88.
Rezazadeh, J., & Garousi H. (2011). Differential persistence of accrual and cash components of earnings and predicting profitability. Accounting and Auditing Reviews, 18(63), 81-94.