The article evaluates the influence of factors on the quality of economic growth in Southeast Vietnam. The article analyzes 138 observations of 6 localities in the Southeast region of Vietnam in the period 2000 - 2022, cited from three main sources: World Bank (WB), the General Statistics Office (GSO), and the Department of Local Statistics. The author uses quantitative research methods: Pooled OLS, fixed effects model (FEM), and random effects model (REM), and the article uses several tests: Hausman test, Wald test, and Wooldridge test. Besides, the article also uses improved standard errors with the "vce (robust)" option to control the phenomenon of heteroskedasticity and autocorrelation. Research results show that the quality of economic growth in the Southeast region is influenced by six factors: physical capital, labor force, average life expectancy, provincial competitiveness index, value of exported turnover, and value of imported turnover. Research also shows that the six localities of the Southeast region have different unique characteristics, but they do not change over time. The study's findings have implications for Vietnamese policymakers in general and local government agencies of provinces and cities in the Southeast region, in particular, to refer to in order to improve policies appropriately.
INTRODUCTION
The Southeast region is one of two parts of Southern Vietnam. Southeast Vietnam includes six localities: Ho Chi Minh City (HCMC), Binh Duong, Dong Nai, Ba Ria-Vung Tau (BRVT), Binh Phuoc, and Tay Ninh. According to GSO (2022), the total population of the Southeast region is 18,887,739 people in an area of 23,560.6 km2, with an average population density of 795 people/km2, accounting for 19.2% of Vietnam's population. The Southeast is the most developed economic region in Vietnam; production accounts for 39.4% of GDP, contributes nearly 50% of the annual national budget (GSO, 2000-2022); is the area with Vietnam's leading economic, financial, cultural, tourism, education, science and technology, and medical center. On the other hand, the Southeast region's growth quality is still low, unstable, and not commensurate with the development potential of Vietnam's critical economic region: low economic growth rate, polluted ecological environment, limited development investment, inadequate infrastructure, high poverty, high gap between rich and poor, limited medical and health care services, labor productivity, and per capita income is still low; There are not many highly qualified workers and labor training does not meet the recruitment needs of domestic and foreign businesses.
This paper aims to analyze the unique characteristics of six localities in the Southeast and evaluate the factors affecting the quality of economic growth (QoEG) in the Southeast region of Vietnam with three new contributions: First, analyze the unique characteristics of six localities in the Southeast. Second, test the factors affecting the quality of economic growth. Finally, evaluate the influence of factors on the QoEG.
Literature Review and Hypothesis
Theoretical Foundations
From a narrow perspective, the quality of economic growth is expressed through indicators: incremental capital-output ratio, education index, public service development, GDP, enterprise competitiveness, industry, and product quality. It can be understood that the quality of economic growth is mainly expressed in two aspects: high total factor productivity, ensuring the maintenance of long-term economic growth and avoiding external fluctuations, ensuring improved economic efficiency, and enhancing the competitiveness of the economy (Ba & Hoa, 2010).
From a broad perspective, QoEG includes economic growth, development, and sustainable development related to four elements: economy, society, environment, and institutions. An economy has good growth quality when there is reasonable and stable economic growth, people's quality of life is improved, the environment is sustainably protected, and state management effectiveness is guaranteed to be appropriate (Ba & Hoa, 2010).
WB and research by Lucas (1990), Sen (1998), and Stiglitz (1998), there are six indicators mentioned about the quality of economic growth: (i) over a long period, a country's economic growth must be stable and avoid fluctuations in other factors; (ii) the economy's competitiveness is high and economic efficiency is always maintained; (iii) total factor productivity contributes highly to economic growth and results in in-depth economy develops; (iv) the ecological environment is protected sustainably during the economic development process; (v) enhance the well-being of citizens and link growth with social justice; and (vi) democratic institutions in the socio-political environment of the economy (Nga, 2015).
Literature Review
The QoEG is a concept that still does not have a unified concept to date. This shows that this is a broad, general concept with connotations including economics, society, politics, institutions, and the environment. Thomas et al. (2000) present three aspects of growth quality: high growth rate needs to be maintained in the long term (economic aspect); growth needs to contribute directly to sustainable improvement of social welfare, specifically the distribution of the fruits of development and poverty reduction (social aspect); and growth associated with sustainable environmental development (environmental aspect) (Hoai, 2017); and research by Ghosh (2016), Ren and Chao (2018) also found factors affecting the QoEG, in addition to physical capital and labor, there are also other factors; such as human capital, total factor productivity, infrastructure, financial system development, government recurrent and investment expenditure, foreign direct investment, culture, integration and institutions of a country; research on the QoEG by Roubini and Sala-i-Martin (1992), Lachler and Aschauer (1998), Mayer (2001), Barro (2002), Benhabib and Spiegel (2002), Görg and Greenaway (2002), Acha et al. (2004), Fisman and Love (2004), Ulku (2004), Isaksson (2006), Montfort et al. (2014), the results show that the main factor affecting the QoEG is total factor productivity, and the determination of total factor productivity through factors such as spending on research and development, technology transfer, and expenditure on research and development public investment targets, financial and monetary system development, international integration development, and politics - law (Isaksson, 2007).
There are studies related to growth quality, including the article by Tran Tho Dat and Do Tuyet Nhung (2011), in which the author writes about the role of total factor productivity in the quality of economic growth. In this study, the author believes that the quality of economic growth focuses on the main criteria: (i) high total factor productivity and ensuring the maintenance of growth rate. Long-term growth, (ii) growth is accompanied by sustainable environmental development, (iii) growth ensures increased economic efficiency and competitiveness, (iv) growth support for innovative democratic institutions, which in turn promote higher rates of growth, which must achieve the goals of improving social welfare and reducing poverty; according to Nguyen Trong Hoai (2017), empirical research on Vietnam's growth quality. In this study, the author analyzes indicators such as the ratio of capital increase to output, total factor productivity, labor productivity, and competitiveness of the economy, thereby helping to point out the advantages as well as weaknesses that need to be overcome to ensure quality growth in the short, medium and long term.
Through theoretical and practical research works in the world and Vietnam, this study builds a framework to analyze the quality of the region's economic growth based on four elements: economic, social welfare, social justice and poverty reduction, environment, and effectiveness of state management.
Development Research Hypotheses
Investment in R&D
Investment in R&D includes investing, conducting, and purchasing new research and technology to serve the survival and development of organizations. Research and development also aim to discover innovations in products, processes, and services, thereby applying those innovations to create unique quality products, processes, and services, innovate to better meet market needs, increase added value, and improve the competitiveness of organizations. Empirical research by Chen and Dahlman (2004), Furman and Hayes (2004), Ulku (2004), and Isaksson (2006) shows that investment in R&D is significant for GDP per capita, contributing to increasing TFP and economic growth.
Hypothesis H1: Investment in R&D will positively impact the QoEG.
Technology Transfer
Technology transfer is the activity of transferring knowledge, skills, technological techniques, production solutions, product models, and facilities between governments or institutions and universities to ensure development and technology are accessible to the majority of users who can innovate and create more than the technological techniques to transform into services, materials, applications, processes, and new products, thereby increasing competitiveness and improving labor productivity. Empirical research by Mayer (2001) and Görg and Greenaway (2002) shows that technology transfer from abroad increases TFP in industrialized countries.
Hypothesis H2: Technology transfer will have a positive impact on the QoEG.
Human Capital
Countries aim for sustainable economic development, so the human factor is of particular concern. People contribute to the growth and development process of a country not only in the form of simple labor but also in the form of capital - human capital. Human capital is the knowledge, skills, abilities, and personal characteristics that can facilitate the creation of personal, social, and economic well-being (OECD, 2001). Human capital is obtained from general education, vocational education, non-formal education, and self-study through each individual's labor practices. Therefore, human capital plays a central role and is an essential factor affecting the QoEG. Empirical research by Barro (2002), Benhabib and Spiegel (2002), Acha et al. (2004), World Bank (2015), and Nguyen Trong Hoai (2017) suggest that human capital positively impacts technological innovation and increases TFP.
Hypothesis H3: Human capital will have a positive impact on the QoEG.
Public Expenditure on Infrastructure
Public expenditure on infrastructure is a significant expenditure of the government, including investment in new construction, renovation, and upgrading of works such as traffic works, electricity, water, schools, hospitals, ports, etc. Public economic infrastructure projects must create conditions for organizations and individuals of all economic sectors to invest in expanding and improving production and business capacity, promoting growth and economic restructuring. Empirical research by Easterly and Rebelo (1993), Hulten (1996), Lachler and Aschauer (1998), Bayar and Özel (2004), and Mahedi (2012) shows that public spending on infrastructure has an impact on TFP growth, thereby improving the QoEG.
Hypothesis H4: Public expenditure on infrastructure will positively impact the QoEG.
Financial System Development
The financial system is the totality of financial activities in different areas of the national economy. However, it has an organic relationship regarding the formation and use of monetary funds in economic entities. - society operates in that field. Develop the financial system to help individuals and businesses access many sources of mobilized capital to expand and develop production and business, so state agencies should promulgate open policy mechanisms. So that individuals and businesses with reputable loans and good projects can access credit sources from financial institutions to serve investment in expansion and technological innovation to improve competitiveness and promote economic growth. Empirical research by Rajan and Zingales (1998) and Fisman and Love (2004) shows that developing the financial system helps businesses have timely growth opportunities and promote economic growth.
Hypothesis H5: Financial system development will have a positive impact on the QoEG.
Institution, Integration
Institutions are a system of interconnected social factors that create rules of conduct. These factors are immaterial, created by humans, but are external to each individual they affect, including rules, beliefs, norms, and institutions (Greif, 2006). Institutions play an important role in the quality of economic growth, and economic integration is the institutional connection between economies. To be more precise, economic integration is a proactive process of doing two things simultaneously: First, linking each country's economy and market with regional and world markets through efforts to open and promote liberalization of the national economy. Second, join and contribute to building regional and global economic institutions. Empirical research by Olson (1991), Przeworski and Limongi (1993), Engerman and Sokoloff (1997), Hall and Jones (1999), Rodrik et al. (2002), Thom (2019), and Ulubasoglu and Doucouliagos (2004) shows that good government institutions and policies have an impact on trade, income, and TFP growth, thereby improving the QoEG. Therefore, good institutions and integration are very important conditions for improving the quality of economic growth.
Hypothesis H6: Institution integration will have a positive impact on the QoEG.
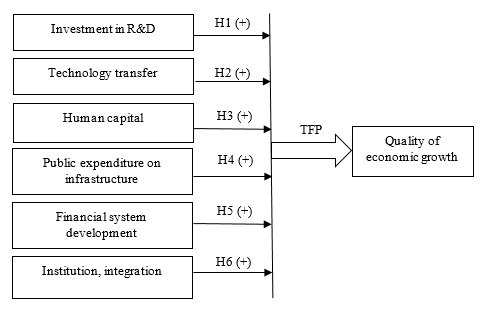
To summarize these hypotheses, the proposed research model is presented in Figure 1:
|
|
|
Figure 1. Proposed research model |
MATERIALS AND METHODS
Research Data Source
This study analyzes panel data in a regression model. Panel data is a combination of cross-section data and time series data. To collect panel data, the author contains many similar subjects at many times. With secondary data collected, 138 observations of six localities in the Southeast region (cross-sectional data) and 23 years in the period 2000 - 2022 (time series data) were collected from three main organizations: GSO, the Statistics Office of six localities, and WB.
Variables and Measures
In the current conditions in the Southeast region, the study uses Robert Merton Solow's theory as the foundation and combines it with endogenous growth theory.
|
Yit = TFPitµ Kitα Litβ |
(1) |
With:
|
TFPitµ = (RDitµ, TEitµ, HUitµ, PUitµ, FIitµ, INIitµ) |
(2) |
In there:
i is the number of localities in the Southeast region (i = 1, 2,…, 6); t is the number of years of observation (t = 1, 2,…, 23); α is the elasticity coefficient of output (Y) with respect to physical capital (K); β is the elasticity coefficient of output according to the labor force (L); µ is the elasticity coefficient of output with respect to total factor productivity; Y is the output of localities in the Southeast region, the study uses a 23-year GDP measure of six localities in the region (Ng & Leung, 2004; Dat, 2011); TFP is total factor productivity; K is physical capital (Ng & Leung, 2004; Dao & Khoa, 2014; Nguyen Trong Hoai, 2017); L is the labor force (Dat, 2011; Dao & Khoa, 2014); RD is the value of R&D investment (Romer, 1990; Chen & Dahlman, 2004; Furman & Hayes, 2004; Ulku, 2004; Isaksson, 2006); TE is the value of technology transfer (FDI capital) (Aitken & Harrison, 1999; Mayer, 2001; Görg & Greenaway, 2002; Keller & Yeaple, 2003; Ng & Leung, 2004); HU is human capital (4 measures): ED is Ratio of state budget spending on education (%), HE: Ratio of state budget spending on health (%), MO: Mortality rate of children under one year, and LI: Average life expectancy (Acemoglu & Zilibotti, 1999; Mayer, 2001; Barro, 2002; Benhabib & Spiegel, 2002; Acha et al., 2004; Dat, 2011; Dat & Nhung, 2011; World Bank, 2015; Ghosh, 2016; Hoai 2017); PU is public spending on infrastructure (quantity of electricity consumption) (Hulten, 1996; Lachler & Aschauer, 1998; Bayar & Özel, 2004; Mahedi, 2012); FI: Financial system development (private credit balance) (Roubini & Sala-i-Martin, 1992; Rajan & Zingales, 1998; Anh et al., 2006); and INI is institution and integration (3 measures): PCI is provincial competitiveness index, EX: Value of export turnover, and IM: Value of import turnover (Acemoglu et al., 2001; Rodrik et al., 2002; Ulubasoglu & Doucouliagos, 2004; Thom, 2019).
Logarithmic linear equations have the form:
|
LnYit = µRDLnRDit + µTELnTEit + µHULnHUit + µPULnPUit + µFILnFIit + µINILnINIit + αLnKit + βLnLit + Vi + Uit |
(3) |
In which µRD, µTE, µHU, µPU, µFI, µINI, α, β are regression coefficients; Vi are proxies unobserved spatial fixed effects; and Uit is the error of the regression model.
Data Analysis Tools
This study uses the Stata 12 software tool; determine and evaluate the influence of factors on growth quality by approaching three distinct models: Random Effects Model (REM), Fixed Effects Model (FEM), and Pooled OLS. The study also conducted a variety of tests to confirm the model's applicability, such as the Wald test (which detects heteroscedasticity), the Wooldridge test (which detects autocorrelation), and the Hausman test (which allows one to select between REM and FEM). Based on this, the regression model is estimated using the FEM technique with enhanced standard error and the "vce (robust)" option to manage the phenomena of heteroscedasticity and autocorrelation, guaranteeing sustainability and analytical efficiency.
RESULTS AND DISCUSSION
Results
Assessing the Unique Characteristics of Localities in the Southeast Region in a Research Model on Economic Growth Quality
First, analyze the regression model without differences in intercept and coefficient between localities of the region over time.
Table 1. Summary of results of OLS regression model analysis
|
R-squared |
Adj R-squared |
F |
Prob > F |
|
0.9794 |
0.9758 |
425.58 |
0.0000 |
|
Dependent variable: LnY |
|||
|
Independent variables: LnK, LnL, LnRD, LnTE, LnED, LnHE, LnMO, LnLI, LnPU, LnFI, LnPCI, LnEX, LnIM |
|||
The results of Table 1 show that the coefficient of determination and the adjusted coefficient of determination are R2 = 0.9794 and R2adj = 0.9758, respectively, and statistical significance level p-value = 0.0000. This shows that the research model is appropriate. With R2adj = 0.9758, the independent variables in the regression model explain 97.58% of the variation of the dependent variable. For this case, it is straightforward. With limited assumptions in the regression model, there is no difference in intercept and coefficient between localities of the region over time. However, each locality in the Southeast region has different characteristics, so the estimation results will show that the origin coordinates are different between localities.
Second, analyze the regression model in cases where the base coefficient is the same but the intercept is different between localities in the region.
Case study of estimating a least squares dummy variable regression model (LSDV) in fixed effects model to evaluate the specificity of six localities of the region.
Table 2. Summary of results of LSDV regression model analysis
|
R-squared |
Adj R-squared |
F |
Prob > F |
|
0.9954 |
0.9947 |
1422.72 |
0.0000 |
|
LnY |
Coef. |
Std. Err. |
P>[t] |
|
LnK |
0.1470*** |
0.0349 |
4.21 |
|
LnL |
0.7453*** |
0.1161 |
6.42 |
|
LnRD |
0.0468*** |
0.0178 |
2.62 |
|
LnTE |
0.0186 |
0.1289 |
1.45 |
|
LnED |
0.0659 |
0.0570 |
1.16 |
|
LnHE |
0.0080 |
0.0396 |
0.20 |
|
LnMO |
-0.0521 |
0.0793 |
-0.66 |
|
LnLI |
1.4679** |
0.6798 |
2.16 |
|
LnPU |
0.0804** |
0.0341 |
2.35 |
|
LnFI |
0.0241 |
0.0354 |
-0.68 |
|
LnPCI |
0.3365** |
0.1435 |
2.34 |
|
LnEX |
0.3224*** |
0.0308 |
10.47 |
|
LnIM |
-0.1142*** |
0.0285 |
-4.01 |
|
Dpro2 |
-1.2865*** |
0.0802 |
-16.02 |
|
Dpro3 |
-1.3795*** |
0.1203 |
-11.47 |
|
Dpro4 |
-1.3435*** |
0.1068 |
-12.57 |
|
Dpro5 |
-1.1467*** |
0.1698 |
-6.75 |
|
Dpro6 |
-1.3503*** |
0.0838 |
-16.11 |
|
_Cons |
-4.3138 |
2.9411 |
-1.47 |
Note: (*), (**), and (***) are statistically significant at 10%, 5%, and 1% respectively.
Looking at the results of Table 2, we can conclude that the regression coefficients of the five dummy variables are, respectively, those of the five localities of the region, and these variables have a p-value of less than 0.05, so they are highly statistically significant. On the other hand, the intercept coefficients of the six localities of this region are statistically different. Specifically, the intercept coefficient of Binh Duong is -1.2865, of Binh Phuoc, is -1.3795, of Dong Nai is -1.3435, of Ho Chi Minh City is -0.1467, and for Long an is -1.3503. This shows that the intercept coefficients of the six localities are different. This difference is because each locality in the region has unique characteristics, such as different mechanisms, policies, management capacities, etc. Over time, other factors may change, such as institutions, fiscal policies, monetary policies, or other external factors that cause the unique characteristics of localities to change.
Third, analyze regression models in the case of regions with similar and distinct characteristics but change over time.
Case study of estimating LSDV over time in a fixed effects model to evaluate the unique characteristics of 6 localities of the region that do not differ over time.
Table 3. Summary of results of LSDV regression model analysis over time
|
R-squared |
Adj R-squared |
F |
Prob > F |
|
0.9828 |
0.9769 |
166.50 |
0.0000 |
|
Dependent variable: LnY |
|||
|
Independent variables: LnK, LnL, LnRD, LnTE, LnED, LnHE, LnMO, LnLI, LnPU, LnFI, LnPCI, LnEX, LnIM, prom t1 to t23. |
|||
Looking at the results of Table 3, it can be concluded that the coefficient of determination and the adjusted coefficient of determination are R2 = 0.9828 and R2adj = 0.9769, respectively, and statistical significance level p-value = 0.0000. There are statistically significant estimates for the time variables t1 through t15, statistically insignificant estimates for the time variables t16 through t22, and complete multicollinearity for the variable t23. As a result, there is no statistical significance in LSDV over time. This leads to the conclusion that while the areas' unique features are similar, they also vary with time. In summary, the regression model is statistically significant in the case of estimating the impact between each locality of the region and not statistically significant in the case of assessing the impact over time (years).
Fourth, analyze regression models in cases where localities of a region have distinct characteristics that are different and change over time.
Table 4. Summary of results of LSDV regression model analysis between localities in the region and over time
|
R-squared |
Adj R-squared |
F |
Prob > F |
|
0.9962 |
0.9947 |
643.14 |
0.0000 |
|
Dependent variable: LnY |
|||
|
Independent variables: LnK, LnL, LnRD, LnTE, LnED, LnHE, LnMO, LnLI, LnPU, LnFI, LnPCI, LnEX, LnIM, dpro2, dpro3, dpro4, dpro5, dpro6, prom t1 to t23. |
|||
Looking at the results of Table 4, it can be concluded that the coefficient of determination and the adjusted coefficient of determination are R2 = 0.9962 and R2adj = 0.9947, respectively, and statistical significance level p-value = 0.0000; The 5 localities of the region have 5 dummy variables corresponding to dpro2 to dpro6 and the coefficients of the independent variables are statistically significant; the time variables from t1 to t22 are statistically insignificant variables, and the variable t23 has perfect multicollinearity. This shows that the specific characteristics of the regions are different and change over time. In summary, the above results show that in the regression model, the impact between each locality of the region is estimated, but in the estimation model, there is no impact over time. This means that the output functions of the six localities of this region are the same and have different intercepts.
Fifth, analyze the regression model in the case between localities of the region where the intercept and the intercept coefficient both change.
Table 5. Summary of result of LSDV regression model analysis with intercept and coefficient both changing
|
R-squared |
Adj R-squared |
F |
Prob > F |
|
0.9996 |
0.9991 |
1768.04 |
0.0000 |
|
Dependent variable: LnY |
|||
|
Independent variables: LnK, LnL, LnRD, LnTE, LnED, LnHE, LnMO, LnLI, LnPU, LnFI, LnPCI, LnEX, LnIM, dpro2-dpro6, BinhDuonga, BinhDuongb, BinhDuongc, BinhDuongd, BinhDuongg, BinhDuongi, BinhDuongt, BinhDuongu, BinhDuongv, BinhDuongw, BinhDuongx, BinhDuongy, BinhDuongz, Bphuoca, Bphuocb, Bphuocc, Bphuocd, Bphuocg, Bphuoci, Bphuoct, Bphuocu, Bphuocv, Bphuocw, Bphuocx, Bphuocy, Bphuocz, DongNaia, DongNaib, DongNaic, DongNaid, DongNaig, DongNaii, DongNait, DongNaiu, DongNaiv, DongNaiw, DongNaix, DongNaiy, DongNaiz, HCMa, HCMb, HCMc, HCMd, HCMg, HCMi, HCMt, HCMu, HCMv, HCMw, HCMx, HCMy, HCMz, TayNinha, TayNinhb, TayNinhc, TayNinhd, TayNinhg, TayNinhi, TayNinht, TayNinhu, TayNinhv, TayNinhw, TayNinhx, TayNinhy, TayNinhz. |
|||
Looking at the results of Table 5, it can be concluded that the coefficient of determination and the adjusted coefficient of determination are R2 = 0.9996 and R2adj = 0.9991, respectively, and statistical significance level p-value = 0.0000; there is a significant relationship between the dependent variable LnY and the independent variables LnL, LnRD, LnYT, LnLI, LnFI, and LnPCI; localities such as Binh Duong, Binh Phuoc, Dong Nai, HCMC, and Tay Ninh have base coefficients different from those of BRVT and are statistically significant (choose BRVT as the locality to compare with the five localities of the Southeast). From the above results, the study discovered different distinct characteristics between localities in the region.
Results of Hypothesis Testing
Pooled OLS, in the case of panel data, often ignores differences in observations over space and time. Therefore, the hypotheses in the Pooled OLS model often violate the multicollinearity phenomenon. This implies that the results of the model's t and F test values will no longer be accurate. Therefore, the author only focuses on evaluating the test values in the two regression FEM and REM and ignores the Pooled OLS.
The Hausman test results show that, with Chi2 = 4614.65 and statistical significance with a confidence level of 99%. This shows that the most suitable model to estimate and assess the impact of factors is FEM.
The Wald test results show that, with Chi2 = 402.84 and statistical significance with a confidence level of 99%. This concludes that the model rejects the Ho hypothesis, and there is a phenomenon of heteroskedasticity.
The Wooldridge test results show that, with Chi2 = 33.825 and statistical significance with a confidence level of 99%. This concludes that the model rejects the Ho hypothesis and has autocorrelation.
Model Selection
To ensure the model's stability and efficiency, as well as highly reliable estimation results, research and select the FEM model and use the improved standard error with the "vce (robust)" option. The study shows results in column 4 of Table 6 to assess the level of impact of factors affecting the QoEG in the Southeast region.
Table 6. Summary of model analysis results of factors affecting the QoEG
|
|
Independent variables |
POOLED |
FEM |
REM |
VCE ROBUST |
|
LnK
LnL
LnRD
LnTE
LnED
LnHE
LnMO
LnLI
LnPU
LnFI
LnPCI
LnEX
LnIM
_cons
Number of obs S-sq Chow test Hausman test Wald test Wooldridge test |
0.0203 [0.32] 0.6174*** [8.10] 0.0531* [1.50] 0.0793*** [3.25] - 0.3136*** [-3.62] 0.0925 [1.47] -0.0446 [-0.30] 3.7826*** [2.94] 0.5463*** [13.04] -0.0637* [-1.77] -0.0758 [-0.29] 0.1699*** [3.46] -0.1624*** [-4.33] -12.9515** [-2.25] 138 0.9781*** |
0.1470*** [4.21] 0.7453*** [6.42] 0.0468** [2.62] 0.0186 [1.45] 0.0659 [1.16] 0.0080 [0.20] -0.0521 [-0.66] 1.4679** [2.16] 0.0804** [2.35] -0.0241 [-0.68] 0.3365** [2.34] 0.3224*** [10.47] -0.1142*** [-4.01] -5.3983* [-1.84] 138 0.9803*** 89.00***
402.84*** 33.825*** |
0.0203 [0.32] 0.6174*** [8.10] 0.0531 [1.50] 0.0793*** [3.25] -0.3136*** [-3.62] 0.0925 [1.47] -0.0446 [-0.30] 3.7826*** [2.94] 0.5463*** [13.04] -0.0637* [-1.77] -0.0758 [-0.29] 0.1699*** [3.46] -0.1624*** [-4.33] -12.9515** [-2.25] 138 0.9266***
4614.65*** |
0.1470*** [8.58] 0.7453*** [11.03] 0.0468 [1.84] 0.0186 [1.02] 0.0659 [1.74] 0.0080 [0.41] -0.0521 [-0.54] 1.4679* [2.10] 0.0804 [1.19] -0.0241 [-0.52] 0.3365** [2.70] 0.3224*** [4.62] -0.1142** [-3.04] -5.3983* [-2.14] 138 0.9803*** |
|
Note: (*), (**), and (***) are statistically significant at 10%, 5%, and 1% respectively.
Discussion
A discussion of the research results is presented below:
Physical capital (K): The region's QoEG is impacted by physical capital. Since the regression coefficient for this component is 0.1470 and the p-value is less than 0.01, the hypothesis is accepted. This indicates that there is a positive correlation between physical capital and regional production. Thus, the fifth influencing component is the rise in regional production of 0.1470 units when the physical capital factor grows by one unit. The findings of this study are consistent with those of Ng and Leung (2004), Dat (2011), Dao and Khoa (2014) and Nguyen Trong Hoai (2017).
Labor force (L): The labor force affects the QoEG of the region. This hypothesis is accepted because the p-value is less than 0.01, with a regression coefficient of 0.7453, proving that the relationship between the labor force and regional output is positive. So, if the labor force increases by 1 unit, the regional output increases by 0.7453 units and is the second strongest influencing factor. This research result is in agreement with the research of Dat (2011), and Dao and Khoa (2014).
Investment in R&D (RD): Investment in R&D does not affect the QoEG of the region. Although there is a positive relationship between R&D investment and output with a regression coefficient of 0.0468, the p-value is greater than 0.1, so this hypothesis is rejected. Therefore, the study has not concluded that investment in R&D affects the region's output as well as the QoEG. This research result is not similar to the research of Romer (1990), Lichtenberg and Siegel (1991), Chen and Dahlman (2004), Furman and Hayes (2004), Ulku (2004), Abdih and Joutz (2005), and Isaksson (2006).
Technology transfer (TE): Technology transfer does not affect the QoEG of the region. With a regression coefficient of 0.0186, technology transfer variables and output do have a positive association; however, since the p-value is larger than 0.1, the hypothesis is not supported. Thus, the study has not come to the conclusion that factors related to technology transfer have an impact on both output and the quality of the region's economic growth. The findings of this study differ from those of Aitken and Harrison (1999), Mayer (2001), Görg and Greenaway (2002) and Keller and Yeaple (2003).
Rate of state budget expenditure on education (ED): The rate of state budget expenditure on education does not affect the QoEG of the region. Although there is a positive relationship between the ratio of state budget spending on education and output with a regression coefficient of 0.0659, the p-value is greater than 0.1, so this hypothesis is rejected. Therefore, the study has not concluded that the ratio of state budget spending on education affects output as well as the QoEG of the region. This research result is not similar to the research of Acemoglu and Zilibotti (1999), Mayer (2001), Barro (2002), Benhabib and Spiegel (2002), Acha et al. (2004) and World Bank (2015).
Rate of state budget expenditure on health (HE): The rate of state budget expenditure on health does not affect the QoEG of the region. Although there is a positive relationship between the ratio of state budget spending on health and output with a regression coefficient of 0.0080, the p-value is greater than 0.1, so this hypothesis is rejected. Therefore, the study has not concluded that the ratio of state budget spending on health affects output as well as the QoEG. This research result is not similar to the research of Acemoglu and Zilibotti (1999), Mayer (2001), Barro (2002), Benhabib and Spiegel (2002), Acha et al. (2004), Dat (2011), Dat and Nhung (2011), and World Bank (2015).
Mortality rate of children under 1 year (MO): The MO does not affect the QoEG of the region. The mortality rate of children under 1 year and output has a negative relationship with a regression coefficient of -0.0521, but the p-value is greater than 0.1, so this hypothesis is rejected. Therefore, the study has not concluded that the mortality rate of children under 1 year affects the output as well as the QoEG of the region. This research result is not similar to the research of Acemoglu and Zilibotti (1999), Mayer (2001), Barro (2002), Benhabib and Spiegel (2002), Acha et al. (2004), Dat (2011), Dat and Nhung (2011), and World Bank (2015).
Average life expectancy (LI): Average life expectancy affects the QoEG of the Southeast. This hypothesis is accepted because the p-value is less than 0.1, with a regression coefficient of 1.4679, proving the positive relationship between average life expectancy and regional output. So if the average life expectancy increases by 1 unit, the region's output increases by 1.4679 units and is the strongest influencing factor. This research result is in agreement with the research of Acemoglu and Zilibotti (1999), Mayer (2001), Barro (2002), Benhabib and Spiegel (2002), Acha et al. (2004), Dat (2011), Dat and Nhung (2011), and World Bank (2015). This shows that the increase in average life expectancy and human capital affects the increase in regional output and contributes to improving the QoEG.
Public spending on infrastructure (PU): Public spending on infrastructure does not affect the QoEG. The factor of public spending on infrastructure and output has a positive relationship with a regression coefficient of 0.0804, but the p-value is greater than 0.1, so this hypothesis is rejected. Therefore, the study has not concluded that public spending on infrastructure affects output as well as the QoEG of the region. This research result is not similar to the research of Lachler and Aschauer (1998), Yilmaz and Hasan (2004) and Mahedi (2012).
Financial system development (FI): Financial system development does not affect the QoEG of the region. The financial system development and output factor has a negative relationship with a regression coefficient of -0.0241, but the p-value is greater than 0.1, so this hypothesis is rejected. Therefore, the study has not concluded that public spending on infrastructure affects output as well as the QoEG of the region. This research result is not similar to the research of Roubini and Sala-i-Martin (1992), Rajan and Zingales (1998), and Anh et al. (2006).
Provincial Competitiveness Index (PCI): Provincial Competitiveness Index affects the QoEG of the region. This hypothesis is accepted because the p-value is less than 0.05, with a regression coefficient of 0.3365, proving the positive relationship between the provincial competitiveness index and regional output. So when the provincial competitiveness index increases by 1 unit, the regional output increases by 0.3365 units and is the third strongest influencing factor. The results of this study are in agreement with the research of Acemoglu et al. (2001), Rodrik et al. (2002) and Tran Thi Minh Ngoc (2018). This shows that the increase in the provincial competitiveness index as well as institutions and integration.
Value of exported goods (EX): The region's QoEG is impacted by the value of exported commodities. This hypothesis is supported since the regression coefficient of 0.3224 indicates a positive association between the value of exported commodities and the production of the region, and the p-value is less than 0.01. As a result, the region's output rose by 0.3224 units, and the value of exported items increased by one unit, making this the fourth influencing factor. The findings of this investigation align with the findings of Acemoglu et al. (2001), Rodrik et al. (2004), Ulubasoglu and Doucouliagos (2004). This shows that the increase in the value of exported goods and institutions and integration affect the increase in regional output and contribute to better QoEG.
Value of imported goods (IM): The value of imported goods affects the QoEG of the Southeast. This hypothesis is accepted because the p-value is less than 0.05, with a regression coefficient of -0.1142, proving that the relationship between the value of imported goods and regional output is negative. So, the value of imported goods increases by 1 unit, and the regional output decreases by 0.1142 units, which is the sixth influencing factor. The results of this study are in agreement with the research of Acemoglu et al. (2001), Rodrik et al. (2004), Ulubasoglu and Doucouliagos (2004).
On the other hand, analyzing and evaluating the unique characteristics between localities in the Southeast region, research results show that there are distinct characteristics between localities in the region that do not change over time. This demonstrates how changes in any one locale will have an impact on changes throughout the Southeast.
CONCLUSION
As a result, the study meets its basic objectives and employs a panel data regression model to assess the impact of variables on the QoEG in the area. Thus, average life expectancy, labor force, provincial competitiveness index, value of exported products, physical capital, and value of imported goods are the six criteria that impact the QoEG, ranked from highest to lowest. Among the six factors, the study discovered four new factors, specifically as follows:
First, the author found a positive relationship between average life expectancy and the output of localities in the Southeast region. This shows that human capital plays an important and central role in the process of improving the QoEG, which shows that the high average life expectancy of localities in the region will contribute to increasing TFP, thereby affecting the QoEG of the region. The increase in output is much higher than the increase in the average life expectancy of the region.
Second, the study shows a positive relationship between the provincial competitiveness index and the output of localities in the Southeast region. Therefore, the provincial competitiveness index and good institutions and integration contribute to improving the QoEG of the Southeast region; the increase in output is lower than the increase in the provincial competitiveness index.
Third, the research also shows a positive relationship between the value of exported goods and the output of localities in the Southeast region. Therefore, good institutions and integration will create conditions for increasing the effective use of resources, thereby raising the value of exported products, raising production, and improving the QoEG in the Southeast area, but output growth is less than the growth in the export goods' value.
Fourth, studies reveal a negative correlation between the Southeast region's local output and the value of imported items. As a result, the region's production will decrease as the value of imported items rises. This indicates that decreasing the value of imported goods will foster the growth of domestic production, raising output and population income and improving the quality of life in the Southeast region; additionally, the decline in output is less than the rise in the value of imported goods in the region.
Besides, the study also shows that localities in the Southeast region have unique characteristics that are different but do not change over time. Therefore, when each locality changes its own characteristics, it will affect the change of the entire Southeast region and promote the region's growth quality faster.
Implications
ACKNOWLEDGMENTS: We would like to thank the reviewers for their helpful comments and suggestions.
CONFLICT OF INTEREST: None
FINANCIAL SUPPORT: None
ETHICS STATEMENT: None
Abdih, Y., & Joutz, F. (2005). Relating the knowledge production function to total factor productivity: An endogenous growth puzzle. IMF Working Paper No.WP/05/74, Washington, DC: International Monetary Fund.
Acemoglu, D., & Zilibotti, F. (1999). Productivity differences. NBER Working Paper No. 6879, Cambridge, MA: NBER.
Acemoglu, D., Johnson, S., & Robinson, J. A. (2001). The colonial origins of comparative development: An empirical investigation. American Economic Review, 91(5), 1369-1401.
Acha, V., Marsili, O., & Nelson, R. (2004). What do we know about innovation? Research Policy, 33(9), 1253-1258.
Aitken, B. J., & Harrison, A. E. (1999). Do domestic firms benefit from direct foreign investment? Evidence from Venezuela. American Economic Review, 89(3), 605-618.
Anh, V. T. T., Hoai, N. T., & Du, H. T. (2006). Financial repression in Vietnam. Fulbright Economics Teaching Program, Fulbright University in Ho Chi Minh City, Vietnam.
Ba, L. X., & Hoa, H. T. (2010). Improving the quality of socio-economic development. Research Institute Central Economic Management, Financial Publishing House, Hanoi.
Barro, R. J. (2002). Quantity and quality of economic growth. Harvard University.
Bayar, Y., & Özel, H. A. (2014). Electricity consumption and economic growth in emerging economies. Journal of Knowledge Management, Economics and Information Technology, 4(2), 1-18.
Benhabib, J., & Spiegel, M. M. (2002). Human capital and technology diffusion. forthcoming in P. Aghion and S. Durlauf (Eds.), Handbook of Economic Growth, 4, Amsterdam: North Holland.
Chen, D. H. C., & Dahlman, C. J. (2004). Knowledge and development: A cross-section approach. Policy Research Working Paper, No. 3366, Washington, DC: World Bank.
Dao, H. T. T., & Khoa, N. D. (2014). The role of human capital in economic growth in the South Central Coast region. Journal of Economic Development, the University of Economics Ho Chi Minh City, 283, 3-19.
Dat, T. T., & Nhung, D. T. (2011). The role of composite factor productivity in the quality of economic growth in Vietnam. Journal of Economics and Development, (169), 22-30.
Dat, T. T. (2011). The role of human capital in growth models. Journal of Economic Research, 393, 3-10.
Easterly, W., & Rebelo, S. (1993). Fiscal policy and economic growth: An empirical investigation. NBER Working Paper No. 4499, Cambridge, MA: NBER.
Engerman, S., & Sokoloff, K. (1997). Factor endowments, institutions, and differential paths of growth among new world economies. in S.H. Haber (Ed.), How Latin America Fell Behind, Stanford, CA: Stanford University Press.
Fisman, R. J., & Love, I. (2004). Financial development and the composition of industrial growth. NBER Working Paper No. 9583, Cambridge, MA: NBER.
Furman, J. L., & Hayes, R. (2004). Catching up or standing still? National innovative productivity among ‘follower’countries, 1978–1999. Research Policy, 33(9), 1329-1354.
General Statistics Office - GSO (2000 - 2022). Statistical Yearbook (2000 - 2022). Statistical Publishing House, Hanoi City, Vietnam.
Ghosh, S. (2016). A quality of growth index: Evidence from Indian States. South Asia Economic Journal, 17(1), 133-148. doi:10.1177/1391561415621827
Görg, H., & Greenaway, D. (2002). Much a do about nothing? Do domestic firms benefit from foreign direct investment? CEPR Discussion Paper 3485, London: CEPR.
Greif, A. (2006). Institutions and the path to the modern economy: Lessons from medieval trade. Cambridge University Press, Cambridge. doi:10.1017/CBO9780511791307
Hall, R. E., & Jones, C. I. (1999). Why do some countries produce so much more output per worker than others? The Quarterly Journal of Economics, 114(1), 83-116.
Hoai, N. T. (2017). Monographs Selected topics of analysis framework and diploma empirical testimony for Vietnam. University of Economics Ho Chi Minh City, Economic Publishing House, Ho Chi Minh City.
Hulten, C. R. (1996). Infrastructure capital and economic growth: How well you use it may be more important than how much you have. NBER Working Paper No.5847, Cambridge, MA: NBER.
Isaksson, A. (2006). Total factor productivity, technological change and change in technical efficiency: A global picture. Mimeo, Vienna: UNIDO.
Isaksson, A. (2007). Determinants of total factor productivity: A literature review. Research and Statistics Branch, UNIDO, 1(101), 672.
Keller, W., & Yeaple, S. R. (2003). Multinational Enterprises, international trade, and productivity growth: Firm-level evidence from the United States. NBER Working Paper No. 9504, Cambridge, MA: NBER.
Lachler, U., & Aschauer, D. A. (1998). Public investment and economic growth in Mexico (No. 1964). The World Bank.
Lichtenberg, F. R., & Siegel, D. (1991). The impact of R&D investment on productivity–New evidence using linked R&D–LRD data. Economic Inquiry, 29(2), 203-229.
Lucas, R. (1990). Why doesn't capital flow from rich to poor countries. American Economic Review, 80(2), 92-96.
Mahedi, M. (2012). Electricity consumption and economic growth in Bangladesh: Co-integration and causality analysis. Global Journal of Management and Business Research, 12(11), 47-56.
Mayer, J. (2001). Technology diffusion, human capital and economic growth in developing countries. Discussion Papers, No. 154, Geneva: United Nations Conference on Trade and Development.
Mlachila, M. M., Tapsoba, R., & Tapsoba, M. S. J. (2014). A quality of growth index for developing countries: A proposal (No. 2014/172). International Monetary Fund.
Ng, Y. C., & Leung, C. M. (2004). Regional economic performance in China: A panel data estimation. RBC Papers on China. Hong Kong Baptist University.
Nga, N. H. (2015). Monograph on institutions and the quality of economic growth in Vietnam. University of Economics - Law, National University Publishing House HCM.
OECD (2001). The Well-being of Nations: The Role of Human and Social Capital. Centre for Educational Research and Innovation. doi:10.1787/9789264189515-en
Olson, M. (1991). Autocracy, democracy, and prosperity. Strategy and Choice, 131(157), 131-157.
Przeworski, A., & Limongi, F. (1993). Political regimes and economic growth. Journal of Economic Perspectives, 7(3), 51-69.
Rajan, R., & Zingales, L. (1998). Financial dependence and growth. American Economic Growth, 88, 559-586.
Ren, B., & Chao, X. (2018). How does the urban–rural income gap affect the quality of China’s economic growth? China Political Economy, 1(1), 136-148. doi:10.1108/CPE-09-2018-005
Rodrik, D., Subramanian, A., & Trebbi, F. (2002). Institutions rule: The primary of institutions over geography and integration in economic development. NBER Working Paper No. 9305, Cambridge, MA: NBER.
Rodrik, D., Subramanian, A., & Trebbi, F. (2004). Institutions rule: The primacy of institutions over geography and integration in economic development. NBER Working Paper No. 9305, Cambridge, MA: NBER.
Romer, P. M. (1990). Endogenous technological change. Journal of political Economy, 98(5, Part 2), S71-S102.
Roubini, N., & Sala-i-Martin, X. (1992). Financial repression and economic growth. Journal of Development Economics, 39(1), 5-30.
Sen, A. (1998). Human capital and human capacity. Economics Notebooks (Santafé de Bogotá), 17(29), 67-72.
Stiglitz, J. (1998). Distinguished lecture on economics in government: The private uses of public interests: Incentives and institutions. Journal of Economic Perspectives, 12(2), 3-22.
Thom, N. T. (2019). Evaluation of Vietnam's economic growth quality after eight years of innovating the growth model. Journal of Political Theory. Scientific Research and Discourse Agency of the National Academy of Politics Ho Chi Minh, (10), 26-31.
Thomas, C. (2000). Global governance, development and human security: The challenge of poverty and inequality (Human Security in the Global Economy), London, UK. Pluto, 168pp.
Ulku, H. (2004). R&D, innovation, and economic growth: An empirical analysis. IMF Working Paper, WP/04/185, Washington, DC: International Monetary Fund.
Ulubasoglu, M. A., & Doucouliagos, C. (2004). Institutions and economic growth: A systems approach. Mimeo, Melbourne: School of Accounting, Economics, and Finance, Deakin University.
World Bank (2015). Global Monitoring Report 2014/2015: Ending Poverty and Sharing Prosperity. doi:10.1596/978-1-4648-0336-9
Yilmaz, B., & Hasan, A. (2004). Electricity consumption and economic growth in emerging economies. Journal of Knowledge Management, Economics and Information Technology, 4(2), 1-18.