Investigation of Effective Factors on High-Speed Internet Customer Loyalty
(Case Study: Saba Net Company)
Hadiseh Alhoda MOHAMMADZADEH1*, Amir KHANLARI2
1 Executive Master of Business Administration, University of Tehran, Tehran, Iran.
2 Assistant Professor in the Department of Management, University of Tehran, Tehran, Iran.
ABSTRACT
Internet service providers (ISPs) are intensively dependent on their customers. Therefore, customer loyalty is crucial for these types of companies. This paper investigates the effects of different variables such as customer satisfaction, service quality, switching cost and corporate image on customer loyalty. Identifying indicators of any variable in this research can help ISPs that their numbers are increasing. Since the internet is becoming pervasive and universal, drawing up effective strategies is beneficial for obtaining loyal customers. The methodology of this research was a descriptive-correlation style. Statistical populations of this research were high-speed internet customers of Saba Net Company in Tehran, Iran. The model of research was evaluated by a sample consists of 384 people and by using a random sampling method. The research instrument was a questionnaire, that its validity was confirmed by the faculty of management of the University of Tehran and specialists and managers of the company in question. The reliability of the questionnaire was assessed by Cronbach’s alpha which value of alpha for all structures was higher than 7.0. The data were evaluated and analyzed by LISREL and SPSS software and the Structural Equation Modeling (SEM) is used as the statistical method. In this research, the effectiveness of several variables such as service quality, customer satisfaction, corporate image and switching costs on customer loyalty were investigated. Among effective factors on customer loyalty, customer satisfaction with an effective coefficient of 0.41 had the most effect. Service quality and switching cost with a reliability level of 95% had a positive and significant effect. Similarly, among two factors of customer satisfaction and service quality, customer satisfaction had more effect on corporate image providing internet services than service quality. Additionally, results showed that corporate image (B = 0.80, T-VALUE =2.80) had a positive and significant effect on customer loyalty. This variable solely indicated 64% of total changes variance of customer loyalty variable.
Keywords: customer loyalty; customer satisfaction; corporate image; switching cost; service quality.
INTRODUCTION
Nowadays, we are faced with the growth of high-speed internet service providers. Also, increasing demand across the country has created a competitive market for internet service providers.
In this situation, the cost of attracting a new customer is 5-6 times more than the required cost of maintaining an old one. According to economic studies, it seems logical that there is a priority among strategic principals in determining appropriate policies to retain current customers, strengthen their loyalty and find suitable methods to have a long-term relationship with customers. However, it is worth to note that the only way of retaining customers is to satisfy their needs, demands, and expectations and, strictly speaking, to meet their satisfaction and provide value to them (Shahin and Teymoori, 2008).
BACKGROUND
Customer loyalty is a deeply held commitment to rebuy or repatronize a preferred product/service consistently in the future, thereby causing repetitive same-brand or same brand-set purchasing, despite situational influences and marketing efforts having the potential to cause switching behavior (Oliver, 1999). Loyalty consists of a psychological process involving the evaluation of different options according to varied criteria. (Beerli et al., 2004). Customer loyalty is dependent on the different factors such as service quality, corporate image, customer satisfaction and switching cost.
Service quality: Received service quality has resulted from a comparison of what customers think providers have to deliver (namely, customer expectations) with what the provider delivers. (Zeithaml & Parasuraman, 1998)
Corporate Image: Corporate image includes information and inferences about the company as an employee, employer, customer, community, supplier, and a corporate citizen. (Adeniji et al., 2015).
Customer satisfaction: Customer satisfaction is an outcome resulted from a comparison of pre-purchasing by a customer about expected performance with the perceived actual performance and paid cost. (Beerli et al. 2004)
Switching cost: Switching cost is defined as psychological, physical and economic costs which customer meets to face the changes of the provider. Gremler & Brown (1998)
Practical Background
Previous researches by researchers like Jamal M. M. Joudeh & Ala’ O. Dandi (2018) on the relationship of service quality, customer satisfaction and loyalty in internet service providers in Jordan show that service quality influences on customer satisfaction and, finally, it is led to customer loyalty.
Also, research conducted by Kandamplully (2007) shows that corporate image is influenced by service quality and customer satisfaction and corporate image is led to customer loyalty, while customer satisfaction also has a direct influence on loyalty.
The research of Sri Minarti Ningsih & Waseso Segoro (2014), shows that customer satisfaction and switching cost had a significant influence on customer loyalty. However, the trust in the brand had no significant influence on the customer loyalty. Furthermore, when tested simultaneously, customer satisfaction, switching cost, and trust in a brand influences the customers' loyalty.
In another research conducted by N. Heydari, B. Hazaveh and M. Ashkani (2015) relationship between service quality, perceived trust and loyalty in an E-commerce environment and, in particular, provider companies of high-speed internet service in Iran are examined and results show that perceived service quality is effective on customer satisfaction. Customer satisfaction, in turn, has a significant effect on trust. Similarly, customer satisfaction and trust have considerable effects on customer loyalty through verbal word-of-mouth relationships.
In another research conducted by Thu Nguyen Quach, Paramaporn Thaichon and Charles Jebarajakirth (2016), dimensions of service quality and their effect on customer loyalty in the provider companies of single-services has been examined. Data obtained from 1231 internet users showed that dimensions of service quality influence (behaviorally and theoretically) on customer loyalty. Rather, however, it is different in the varied groups of ISP customers.
In research of Rini & Absah (2018) about Sumatra Otara Bank in Madan, Indonesia, customer satisfaction variable influences on customer loyalty, the results showed that guarantee and sympathy have a considerable effect on customer satisfaction while trust is ineffective on it. Also, sympathy and trust have a high effect on customer loyalty.
In the research conducted by Haile (2018) on the effective factors on the customer loyalty of Ethiopia Bank, results show hypotheses of positive and significant effect of trust on the bank, the commitment of the bank to customers, customer satisfaction from being provided with services and switching cost on the customer loyalty has been confirmed. However, the hypothesis of the significant effect of corporate image on it has been rejected.
In another research, Farida (2018) has examined the effect of competitive price, price guarantee, service quality and customer satisfaction on the customer loyalty of online taxis in Surakarta. The results show that competitive price and service quality have a considerable and positive effect on customer loyalty. Similarly, customer satisfaction is effective for their loyalty.
Furthermore, in the research conducted by J. Bahari (2018) in the hotel industry, the service quality variable has a direct and significant effect on customer satisfaction and loyalty. Also, the effect of customer satisfaction on loyalty is direct and significant and, on the other hand, service quality variable by the intermediary role of customer satisfaction has an indirect and significant effect on customer loyalty.
Conceptual Model
According to studies conducted among the loyalty models all over the world and reviewing of literature of this field about relationship of “customer loyalty”, “customer satisfaction”, “switching cost”, “corporate image” and their effect on the loyalty, due to the following models, we achieved a proposed model.
The primary framework of this research is Kandmpully & Hui 2007 model. In this model, service quality and customer satisfaction influence directly and indirectly on loyalty. Similarly, service quality and customer satisfaction are effective in corporate image. Given that the effect of switching cost on the loyalty in the conducted researches in recent years has been very significant and considering that switching cost factor-like ranging the line and, in some cases, changing the modem plays a key role in their maintenance according to many high-speed internet subscribers, hence, we add this factor to the proposed model. The proposed model in this research is given as follows:
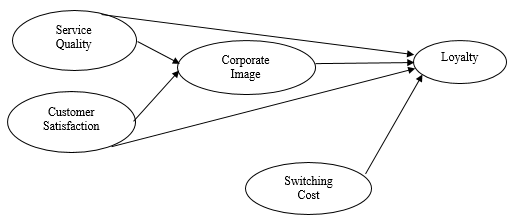
Diagram 1: The loyalitu proposed model
METHODOLOGY
The purpose of the present research is applicable and it is methodologically considered as descriptive-correlative. It has been collected as the required data of this research project as a library and field research. The methodology is based on using the questionnaire to determine the amount of importance and effectiveness of each of the derived factors. It should be noted that the content of the questionnaire consists of two separate parts: general and specialized questions. In the part of general questions, sex, age, education and duration of use are asked. In the part of specialized questions, valid scales are used and prepared from a standard questionnaire consists of 30 questions. Five-choice Likert to assess all specialized questions is used. The structures, the reference and the number of questions of each variable are summarized in Table 1:
Table 1: Dimensions and indicators of the questionnaire
|
Dimension |
Indicators (Operational Definitions) |
Reference (s) |
|
|
Customer satisfaction |
The feeling of satisfaction from the provided service. Adaption to customer expectation The feeling of satisfaction from the relationship between customer and provider company. |
Lam, Shankar, Erramilli, Murphy (2004) |
|
|
Corporate Image (CI) |
The positive opinion of customers. Having a better image than competitors. The innovation of the company. |
Kandamplully and Hui (2007) |
|
|
Switching cost (SC) |
Financial cost in a case of switching from a company to other Spending high energy and time in a case of Switching from a company to other Non-trust of customers in the case of switching from a company |
Lam, Shankar, Erramilli, Murphy (2004) |
|
|
Customer loyalty (L) |
Priority of selection Proposition to others Mention positive points Extend subscription Purchase new services Refer to receive data |
Bloemer and Odekerken-Schroder (2002) |
|
|
Service quality (QUA) |
Tangible factors (TAN) |
Staff status Physical and external facilities Use the latest technologies |
Zeithaml & Parasuraman(1996) |
|
|
Response (RES) |
Determine the time of receiving services Preparedness to respond Diversity in services |
|
|
|
Trust of assurance (AS) |
Provide a feeling of security Staff knowledge Staff behavior |
|
|
|
Empathy (EMP) |
Access Individual attention Personal accountability |
|
|
|
Reliability (REL) |
Provide documents correctly Provide error-free services at a specified time Sincere attention to troubleshooting |
|
The statistical population for this research, due to the nature of research are real customers of Saba Net Company in Tehran city. This company provides high-speed internet service. Since the statistical population of the research was large and broad and since this company did not intend to disclose the exact number of its statistical population, a sample of 384 people is determined randomly, using the Cochran formula for the indefinite statistical population. The validity of the questionnaire was assessed according to marketing professors, specialists and managers in the questioned company to draw up the questionnaire. The reliability of used different parts in the questionnaire was proved by Cronbach’s alpha which value of alpha for all structures is higher than 7.0.
Similarly, to analyze and test hypotheses of the research, multiple regression and Structural Equation Modeling are used.
FINDINGS OF RESEARCH
Due to the results of the questionnaire’s first parts (demographic characteristics), presented the following information on the characteristics of the statistical sample is briefly.
Findings of the research in the demographic investigation of customers in a 384 sample is as follows:
Table 2: Demographic investigation of respondents
|
Frequency index (%) |
Missing data (%) |
|
sex: female (21.3) – male (78.2) |
0.5 |
|
age: less than 20 (5.2), 20-30 (42.5), |
0.5 |
|
Education |
1.25 |
|
duration of use |
0.5 |
Multiple Regression
Table 3: Multiple regression of independent variable on dependent one
|
Variable |
R |
R2 |
F |
Df |
sig |
|
Customer loyalty |
0.899 |
0.807 |
352.024 |
7 |
0.000* |
To determine the amount of effectiveness of varied variables on customer loyalty, multiple regression is used. Its results illustrated in Table 3 indicate that the given varied variables explain 80.7% of changes in customer loyalty. Table 4 indicates that duration of use, customer satisfaction, corporate image and service quality have a positive and significant effect on customer loyalty so that duration of use, customer satisfaction, corporate image and service quality increase customer loyalty in an amount of 4%, 43.2%, 33%, 17.9%, respectively. This amount of effectiveness is obtained from the coefficients of Beta.
Table 4: Standardized coefficients of independent and dependent variables
|
Variable |
Non-standardized coefficient (B) |
Standardized coefficient (Beta) |
t |
sig |
|
Age |
-0.261 |
-0.011 |
-0.572 |
0.568 |
|
Education |
-0.172 |
-0.009 |
-0.487 |
0.627 |
|
Duration of use |
0.738 |
0.044 |
2.424 |
0.016* |
|
Customer satisfaction |
0.460 |
0.432 |
12.840 |
0.000* |
|
Corporate image |
0.343 |
0.330 |
8.566 |
0.000* |
|
Service quality |
0.214 |
0.179 |
5.169 |
0.000* |
|
Switching cost |
0.024 |
0.12 |
10.5 |
0.000* |
|
Fixed coefficient |
-1.342 |
- |
-0.520 |
0.604 |
To assess the amount of effectiveness of variables of service quality and customer satisfaction on corporate image, linear regression is used. The results show that 76.5% of changes in corporate image is explained by these two variables.
Table 5: Linear regression of independent and dependent variables
|
Variable |
R |
R2 |
F |
Df |
sig |
|
Corporate image |
0.875 |
0.765 |
990.059 |
2 |
0.000* |
Table 6 illustrates that both variables of service quality and customer satisfaction have a positive and significant effect at a level of 99% on corporate image. The amount of effectiveness of customer satisfaction on the corporate image is 46.3% and service quality on the corporate image is 46.5%. This coefficient indicates that corporate image is increased by 3.46% for a 1% increase in customer satisfaction.
Table 6: Standardized coefficients of independent and dependent variables
|
Variable |
Non-standardized coefficient (B) |
Standardized coefficient (Beta) |
t |
sig |
|
Age |
-0.261 |
-0.011 |
-0.572 |
0.568 |
|
Education |
-0.172 |
-0.009 |
-0.487 |
0.627 |
|
Duration of use |
0.738 |
0.044 |
2.424 |
0.016* |
|
Customer satisfaction |
0.460 |
0.432 |
12.840 |
0.000* |
|
Corporate image |
0.343 |
0.330 |
8.566 |
0.000* |
|
Service quality |
0.214 |
0.179 |
5.169 |
0.000* |
|
Switching cost |
0.024 |
0.12 |
10.5 |
0.000* |
|
Fixed coefficient |
-1.342 |
- |
-0.520 |
0.604 |
Confirmatory Factor Analysis of Questionnaire Construct
Before testing the structural model and measuring to analyze the process of a conceptual model by LISREL software, we evaluated questions used in the questionnaire by separating the research variables in terms of the fit capability of the model. In this section, using measuring models of the structural equation model, the accuracy of measuring constructs is examined by related indicators. So, using a confirmatory factor analysis of the first stage, whether designed questions in each construct can measure the relevant construct or not is determined. At first, to measure the validity value of research constructs, the most important criterion is factor loading. The given minimum value for supporting the significance of factor loading is 0.5 and it should be removed values below 0.4 and the model is modified and its validity is evaluated. Another index considered in supporting the construct validity is the average variance extracted (AVE) index. The minimum value to admit this index is 0.5 and when factor loads of related questions to a construct are 0.4-0.5 and AVE of a construct is more than 0.5, the validity of the given construct is supported and it is not required that a researcher removes question (s) with a factor loading of 0.4-0.5. Standardized coefficient model of first-order constructs – dimensions of service quality, customer loyalty, corporate image, switching cost and customer satisfaction – (Figure 1) shows that factor loading values of all questions of first-order constructs are more than 0.5 and according to Figure 2of significance coefficient model, it has supported the validity of the given constructs at the level of observed variables. The standard coefficient model represents the high capability of questions to explain their corresponding constructs. The significance coefficient model also supports an amount of capability of questions at the trust level of 95%. The significance numbers model or T-value represents an amount of being significant to each of the parameters and if its value is greater than the absolute value of 1.96, parameters of the model are significant. Given that all significance numbers of all parameters of the model are greater than 1.96; then the validity of measurement constructs of the relevant variables is supported at the level of significance of 0.05. Similarly, more values than 0.5 of the AVE index support convergent validity of the construct at the level of hidden variables. Due to the fit indicators of first-order measurement models in the research model, the chi-square value has a freedom degree of 1.86 and less than 3. Also, the value of the estimation variance of Root Mean Square Error of Approximation (RMSEA) is equal to 0.065 and less than 0.08. Also, Comparative Fit Index (CFI), Incremental Fit Index (IFI), Normed Fit Index (NFI), Non-Normed Fit Index (NNFI) are all higher than 0.9, then, measurement models represent a good fit and are supported.
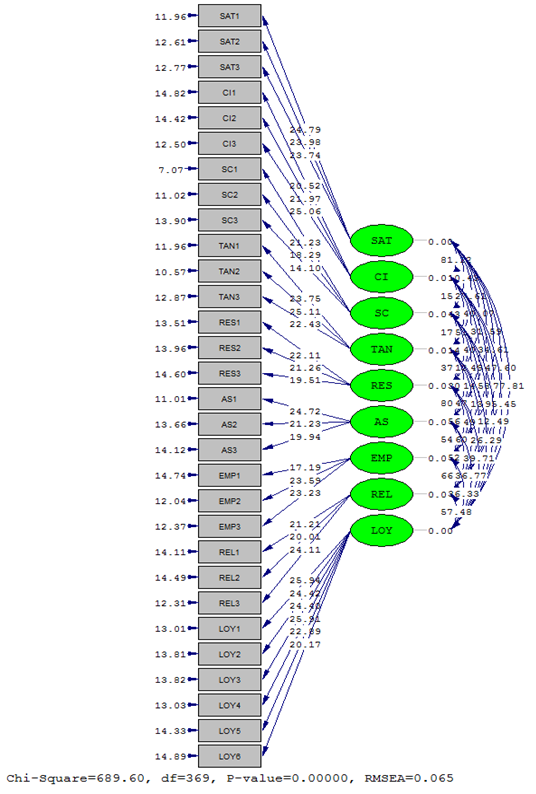
Figure 1: First-order significance numbers model of first-order constructs
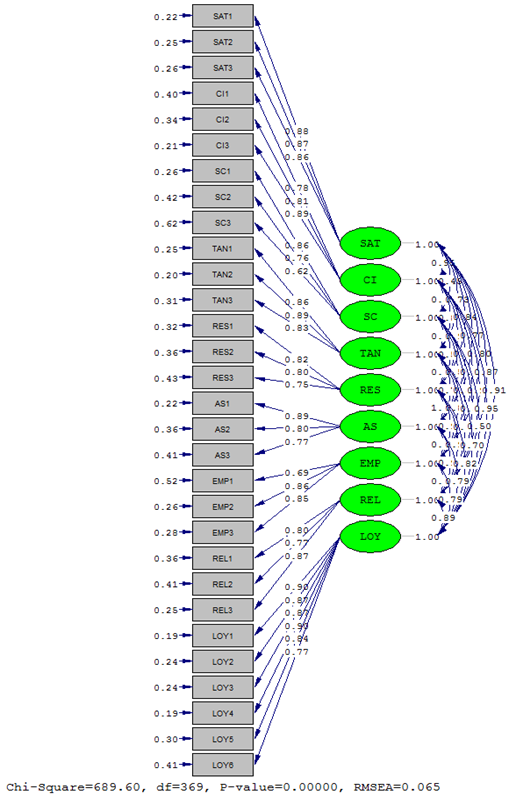
Figure 2: Standard estimate model based on the binary correlation coefficients of first-order constructs
Fit indicates measurement models (Confirmatory Factor Analysis)
Normed Fit Index (NFI) = 0.98> 0.90
Non-Normed Fit Index (NNFI) = 0.98 > 0.90
Comparative Fit Index (CFI) = 0.98 > 0.90
Incremental Fit Index (IFI) = 0.98 > 0.90
Relative Fit Index (RFI) = 0.98 > 0.90
Standardized RMR = 0.064 < 0.08
Parsimony Goodness of Fit Index (PGFI) = 0.65 > 0.5
Parsimony Normed Fit Index (PNFI) = 0.83 > 0.5
Analysis of the Conceptual Process of Model
To test a conceptual model of research and hypothesis of the model from data analysis, the structural equation model is used. LISREL software of 8.80 is used to estimate the method of the maximum likelihood. To examine the research model consists of three independent variables (customer satisfaction, switching cost, and service quality), an intermediary variable (corporate image) and a dependent variable (customer loyalty), we should be ensured the goodness and suitable fit before supporting the structural relationship. In the research model, the chi-square value is with the freedom degree of 2.39 and lower than 3. Similarly, the value of the root mean square error of approximation error variance (RMSEA) is equal to 0.071. Also, Comparative Fit Index (CFI), Incremental Fit Index (IFI), Normed Fit Index (NFI), Non-Normed Fit Index (NNFI) are all greater than 0.9, then it is represented and supported as a fit model. The following Figures represent significance numbers and a standardized estimate of the structural equation model for research conceptual model.
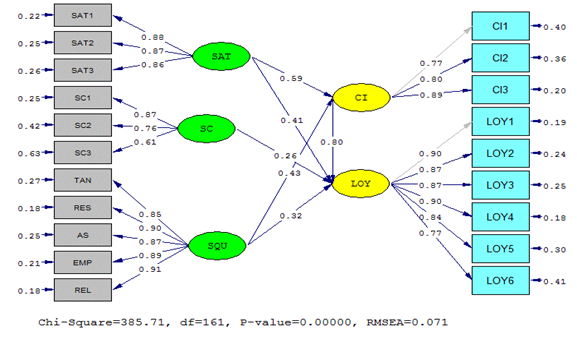
Figure 3: Standard estimate model based on the binary correlation coefficients of the conceptual model
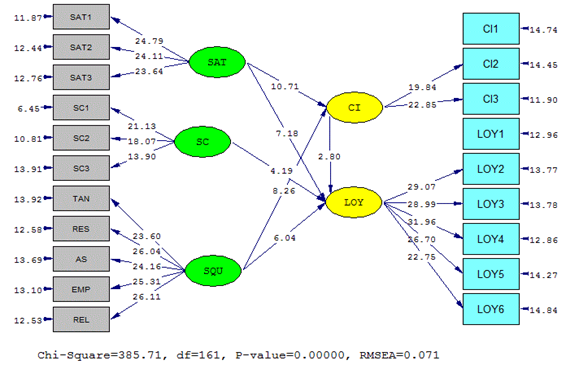
Figure 4: Significance numbers model of a conceptual model
Due to the measurement of standardized coefficients, it may be derived that there is a positive and significant between the relevant variables and their corresponding indicators. The standardized coefficients represent coefficients of process or standardized factor loadings between factors and indicators. Coefficients of factor loadings will be stronger. To have validity, it must be a positive and significant correlation between construct and dimension and between dimension and index. The standard estimate model is a model derived from the adaption of two covariance matrixes of the data model and the real estimate represents parameters of the model. This model is represented the amount of relationship between construct and dimension, dimension and index; while the relationship is higher than 0.5, it can be said that the relevant questions have a good explanation capability.
As stated, the standard coefficient model is represented because it provides the possibility of comparison between items and constructs with binary correlation coefficients, rather, it can not be used on the largeness and smallness of these coefficients but T index must be used to determine the significance of these coefficients of process. The significance numbers model (Figure 4) is represented to know whether the relationship between construct and item is significant or not. The significance numbers model or T-Value represents the amount of significance of each of the parameters and if its value is greater than the absolute value of 1.96, parameters of the model are significant. Given that some significant numbers of model parameters are greater than the absolute value of 1.96, then it is supported the hypothesis of variable related to it.
Table 7: Results obtained from conceptual model findings at the level of 5% reliability
|
hypotheses of a conceptual model |
T-Value |
Standard coefficient |
Hypotheses |
|
|
In providing companies with internet service in Iran, customer satisfaction is effective in customer loyalty. |
7.18 |
0.41 |
1 |
Supported |
|
In providing companies with internet service in Iran, corporate image is effective in customer loyalty. |
2.80 |
0.80 |
2 |
Supported |
|
In providing companies with internet service in Iran, the switching cost is effective in customer loyalty. |
4.19 |
0.26 |
3 |
Supported |
|
In providing companies of internet service in Iran, customer satisfaction is effective in corporate image |
10.71 |
0.59 |
4 |
Supported |
|
In providing companies with internet service in Iran, service quality is effective in corporate image. |
8.26 |
0.43 |
5 |
Supported |
|
In providing companies with internet service in Iran, service quality is effective in customer loyalty. |
6.04 |
0.32 |
6 |
Supported |
|
Chi-square = 385.71; RMSEA = 0.071 < 0.08; X2/df = 2.39 < 3 Normed Fit Index (NFI) = 0.98 > 0.90 Non-Normed Fit Index (NNFI) = 0.98 > 0.90 Parsimony Normed Fit Index (PNFI) = 0.83 > 0.5 Comparative Fit Index (CFI) = 0.98 > 0.90 Incremental Fit Index (IFI) = 0.98 > 0.90 Relative Fit Index (RFI) = 0.97 > 0.90 Standardized RMR = 0.069 < 0.08 Goodness of Fit Index (GFI) = 0.84 Parsimony Goodness of Fit Index (PGFI) = 0.65 > 0.5 |
As derived from Table 7 and Figures 4 and 5, it supported the analysis of 5 confirmatory processes of the research variable due to the process standard coefficients and significant numbers and it indicates that the existing relationships are supported based on the derived theories and collected data from the sample.
Results of Table 7, indicate that among the effective factors on the customer loyalty, the customer satisfaction with effect coefficient of 0.41 has the most effectiveness and service quality (B = 0.32, T-VALUE =6.04) and switching cost (B = 0.26, T-VALUE =4.19) has also a positive and significant at the level of 95% reliability, respectively. Similarly, among two factors of customer satisfaction) and service quality, customer satisfaction (B = 0.59, T-VALUE = 10.71 has more effect on the corporate image provided internet service than service quality (B = 0.80, T-VALUE = 8.26); and also the results indicate that corporate image (B = 0.80, T-VALUE = 2.80) represents 64% of total variance of changes of customer loyalty variable.
CONCLUSION AND PROPOSITIONS
According to the results obtained from a regression of the demographic data, age and education of customers do not have any effect on loyalty but the duration of use is effective an amount of 4%.
According to results obtained from the process coefficient and value of significance level presented in the above Table, it has been supported all hypotheses of the model at the level of reliability of 95%. Customer satisfaction has a significant effect on customer loyalty. To compare results of the test with researches Sri Minarti Ningsih, Waseso Segoro (2014), Rini, E. & Absah Y. (2018) who have accepted the direct and positive relationship between customer satisfaction and loyalty shows that results of testing this hypothesis are in line with previous researches.
It has been supported the second hypothesis which examined the effect of corporate image variable on customer loyalty (B = 0.80, T-VALUE = 2.80). To compare the results of this test with the researches of Anderson and Lindstad (1998), Kandampully & Hu (2007) who have accepted a direct and positive relationship between company image and loyalty show that the results of testing this hypothesis are in line with the previous researches.
On the third hypothesis, the switching cost variable can have a significant effect on customer loyalty (B = 0.26, T-VALUE = 4.19). Therefore, the third hypothesis is supported. Previously, in the literature and background of this field due to researches Haile, A., (2018), Sri Minarti Ningsih, Waseso Segoro (2014) this relationship has been supported.
The customer satisfaction variable at the level of 95% reliability has a significant effect on the corporate image (B = 0.59, T-VALUE = 10.71). Due to the significant coefficient of this relationship, it can be stated that customer satisfaction has a significant effect on corporate image and this hypothesis of the research is supported. Therefore, the more customer satisfaction is improved, the more corporate image will be improved equally. Thus, the fourth hypothesis is supported.
The service quality variable at the level of 95% reliability has a significant effect on the corporate image (B = 0.43, T-VALUE = 8.26). Therefore, the fifth hypothesis is supported. The results of many kinds of research show that the capability of a company to continuously deliver superior service has a positive effect on the corporate image, For example, Kondamply and Hui (2007) state that service quality facilitates to promote the company’s image or service organization.
The service quality variable at the level of 95% reliability has a significant effect on customer loyalty (B = 0.32, T-VALUE = 6.04). Therefore, the sixth hypothesis is supported. This hypothesis has been already examined in the studies of Aydin and Ozer (2005), Kondamply and Hui (2007) and it has supported a direct relationship between service quality and loyalty.
Due to supporting the effect of “switching cost”, “corporate image”, “customer satisfaction” and “service quality” on the “customer loyalty” and effect of “service quality” on the “corporate image”, we should find ways to improve effective factors on “customer satisfaction”. Propositions obtained are based on the results of tests. Since the effectiveness of customer satisfaction is directly more than other variables and, also, customer satisfaction is indirectly effective on customer loyalty by influencing corporate image, then the most important factor among the factors directly influencing customer loyalty is customer satisfaction.
In respect to the said points, executive propositions for increasing customer loyalty is as follows:
It can track customer’s interactions providing a comprehensive database and it can identify their preferences and tendencies in terms of their records.
It can help customers for quick and easy decision-making in purchasing by the segmentation of customers and customizing and data-giving about the services based on the record of their interactions, preferences, and tendencies.
It can predict the future needs of customers continuously evaluating the relationship with them and it can provide their demands at the right time.
It can also raise customer’s switching costs and increase their loyalty by granting cash discounts or special privileges to customers who have earned a special score more than the specified quota.
It is appropriate that customers achieve a high level of collaboration and communication with the company in which case the switching of the software will take more time and effort of the customers and increase switching costs given customer’s knowledge and their dependence on the company.
To improve corporate image it can improve the mindset of customers about innovation and progression of a company. It can be achieved by investing in the research and development and emphasizing the matter and obtained innovations in the field of software in the messages which are sent by the company.
To improve service quality, we must focus on the importance of the removal of customer’s need by expert, the necessity of attention of experts to the customer, way of understanding their needs and placing these indicators in the evaluation system of experts by drawing up the training programs for staff to rise customer-centric morale.
Also, it can promote the level of quality by attracting and employing communicative and polite experts and drawing up programs that promote the level of knowledge of experts.
References
Adeniji, A. A., Osibanjo, A. O., Abiodun, A. J., & Oni-Ojo, E. E. (2014). Corporate image: A strategy for enhancing customer loyalty and profitability. Journal of South African Business Research, 2015.
Andreassen, T. W., Lindestad, B., & Barometer, C. S. (1997). Customer Loyalty and Complex Services: The Impact of Corporate Image on Quality, Customer Satisfaction. Management, 8(4), 2-22.
Aydin, S., & Özer, G. (2005). The analysis of antecedents of customer loyalty in the Turkish mobile telecommunication market. European Journal of marketing.
Bahari, J., Bahari, S., Bazleh, M., & Bahari, H. (2018). The Impact of Service Quality on Customer Satisfaction, Customer Loyalty and Brand Image in the Hotel Industry (Case Study: Five Star Hotels Tabriz City. 14(56), 71-83.
Beerli, A., Martin, J. D., & Quintana, A. (2004). A model of customer loyalty in the retail banking market. European journal of marketing, 38, 253-75
Bloemer, J., De Ruyter, K., & Peeters, P. (1998). Investigating drivers of bank loyalty: the complex relationship between image, service quality and satisfaction. International Journal of bank marketing 16(7).
Bloemer, JMM & Odekerken-Schröder, GJ 2002, 'Store Satisfaction and Store Loyalty Explained by Customer- and Store-Related Factors', Journal of Consumer Satisfaction/Dissatisfaction and Complaining Behaviour, 15, 68-80.
Farida, N. & Setiswsn, A., (2018), Loyalty Factor Identification of using online- Based Taxi, The International Journal of Business & Management, 6, 160-164.
Gremler, D. D., & Brown, S. W. (1998). Service loyalty: Antecedents, components, and outcomes. In American Marketing Association. Conference Proceedings (Vol. 9, p. 165). American Marketing Association. (Winter) 165-166.
Haile, A., (2018), Factors Affecting customer Loyalty in Banks: The case of Commercial Bank Ethiopia, The international Journal of business & management. 6(1), 236-247.
Haji Heydari, N. , Hazaveh, B. & Ashkani, M., (2015), (in Persian) A Survey on Relations among Service Quality, Customer Satisfaction, Trust and Loyalty in Internet Service Providers, Social Science and Managerial Economic, https://www.civilica.com/Paper-ICEMSS01-ICEMSS01_145.html
Joudeh, J. M., & Dandis, A. (2018). Service Quality, Customer Satisfaction and Loyalty in an Internet Service Providers. International Journal of Business and Management, 13(8), 108-120.
Kandampully, J., & Hu, H. H. (2007). Do hoteliers need to manage image to retain loyal customers? International Journal of Contemporary Hospitality Management. 19(6), 435-443
Lam, S. Y., Shankar, V., Erramilli, M. K., & Murthy, B. (2004). Customer value, satisfaction, loyalty, and switching costs: an illustration from a business-to-business service context. Journal of the academy of marketing science, 32(3), 293-311.
Lee, J., Lee, J., & Feick, L. (2001). The impact of switching costs on the customer satisfaction‐loyalty link: mobile phone service in France. Journal of services marketing. 15(1), 35 –48.
Minarti, S. N., & Segoro, W. (2014). The influence of customer satisfaction, switching cost and trusts in a brand on customer loyalty–The survey on student as IM3 users in Depok, Indonesia. Procedia-Social and Behavioral Sciences, 143, 1015-1019.
Oliver, R.L., “A Cognitive Model of the Antecedents and Consequences of Satisfaction Decisions,” Journal of Marketing Research, Vol. 17, No. 4:460-469, 1980.
Oyeniyi, O., & Abiodun, A. J. (2010). Switching cost and customers loyalty in the mobile phone market: The Nigerian experience. Business intelligence journal, 3(1), 111-121.
Parasuraman, A., Zeithaml, V. A., & Berry, L. L. (1985). A conceptual model of service quality and its implications for future research. Journal of marketing, 49(4), 41-50.
Quach, T. N., Thaichon, P., & Jebarajakirthy, C. (2016). Internet service providers' service quality and its effect on customer loyalty of different usage patterns. Journal of Retailing and Consumer services, 29, 104-113.
Rini, E. S., & Absah, Y. (2018). The Analysis of Relationship Marketing Influence on Loyalty through Customer Satisfaction of Martabe Savings by. The Social Sciences, 13(4), 877-882.
Shahin, A. &Teymoori, H. (2008), Customer Loyalty: Concepts and Patterns, Isfahan, Publication of Isfahan University (in Persian)
Wang, C. Y. (2010). Service quality, perceived value, corporate image, and customer loyalty in the context of varying levels of switching costs. Psychology & Marketing, 27(3), 252-262.