Socio-Economic Factors Affecting Road Accidents
Vahid MAJED1, Ghahreman ABDOLI2, Ghadir MAHDAVI3, Hamed KHODAEI4*
1 Assistant Professor of Economics, University of Tehran, Faculty of Economics, Tehran, Iran.
2 Professor of Economics, University of Tehran, Faculty of Economics, Tehran, Iran.
3 Assistant Professor of Eco College of Insurance, Allameh Tabataba'i University, Tehran, Iran
4 Ph. D student of economics, University of Tehran, Aras International campus, Iran.
*Corresponding Author:
Email: hamedkhodayi @ yahoo.com
ABSTRACT
Transportation and communication are one of the main infrastructures of every country's economy, and nowadays, they are considered as one of the indicators of countries' development. Despite the high significance of road transport in the development of societies, the growth and expansion of the number of vehicles, road accidents and traffic fatalities and the high economic and social costs caused by them have challenged transport authorities and traffic experts. In developing countries, road accidents increase until they reach a certain threshold level of income, and then this rate declines. This relationship is similar to Kuznets bio-environmental hypothesis. In this study, the socio-economic factors affecting road accidents in the context of Kuznets bio-environmental hypothesis are examined. The results show that there is a significant inverted U-shaped relationship between the economic growth in Iran and road fatalities. Additionally, the results of estimating the country and provincial patterns indicate that in the provincial pattern, the variable of the number of cars, and in the country pattern, the variable of gross domestic product, has the most effect on accidents.
Keywords: Accidents, Kuznets Bio, Environmental Hypothesis, gross domestic product (GDP).
INTRODUCTION
Transportation and communication are one of the main infrastructures of every country's economy, and nowadays, they are considered as one of the indicators of countries' development. With the extension of mechanical life and the increasing traffic in cities and roads in the last half century, in contrast with the economic and welfare benefits of expanding communications and the speed of carrying freight and passenger, the number and severity of traffic accidents have rapidly increased. Therefore, the issue of road accidents and their consequent financial and life losses have become one of the most important economic and social challenges for human being. Undoubtedly, the effects and consequences of road accidents are irreversible if they lead to death, road accidents are one of the most important causes of deaths and severe physical and financial losses to human, and the social, cultural and economic impacts of them have severely threatened human societies. In fact, the severe impacts of road accidents, are health-damaging regarding health issues, a dangerous phenomenon destroying families regarding social issues, and a dangerous phenomenon destroying cultural educators and cultural heads of households regarding cultural issues, and a dangerous phenomenon destroying the political credibility of crisis-hit countries regarding political issues, a dangerously phenomenon destroying very scarce economic resources including human resources, and in fact, they are one of the most important agents damaging the main factor in the development of societies i.e. human resources. Iran is also one of those countries where the rate of accidents due to disregard to safety principles and their affecting factors, has always been increasing. As based on the statistics released by the World Health Organization in 2017, Iran ranked the eighth regarding the number of accidents comparing to the various countries of the world (based on the number of deaths per 10,000 people), Iran with the number of 32.1 in every 100000 people, ranks the eighth in the world.
Research hypotheses:
THEORETICAL BASES
With increasing the number of vehicles, road accidents also increase. The economic impact of these accidents at the early stages is small. However, as the percentage of growth in vehicles increases, the economic impact of the accident becomes more and more problematic, and it increasingly becomes challenging, and affects the country's economy. In general, the various factors that cause an accident can be categorized as the road, vehicle and human factor (Jamali, 2015).
The results of the empirical studies have indicated that the road accidents in developing countries increase until they reach a certain threshold level of income, after that, the rate decreases (Mohammadi et al., 2012). This relationship is similar to the Kuznets curve, which states that there is a relationship between income heterogeneity and per capita income. To investigate the Kuznets hypothesis regarding road traffic accidents, researchers usually categorize road accidents as environmental pollution in their research literature. An analysis based on which they express the relevance of the Kuznets hypothesis with road accidents, is that as low-income societies are less able to allocate the necessary resources to establish the relevant organs and implement road safety policies which result in more accidents and fatalities. And at this level of income, the demand for road safety is lower. Yet at high levels of income, societies focus more on road safety, since more resources are available to invest on road safety, and more effective regulatory organs, and people also have a higher level of demand for road safety (Law et al., 2011).
Experimental Research Background
Investigating the Long-Term Relationship between Road Accidents and Factors Affecting it in Iran:
Roya and Seyyed Ali Al Emran (2015): In this study, the long-term relationship between road accidents and the factors affecting it in Iran has been investigated from the years 2006 to 2013. In the study, the Johansen-Joselius method was used to examine the relationship between accidents and the factors affecting them over a time interval from 2006 to 2013.
Based on the findings of this study, the effect of variables on road accidents has been significant in a way that in the long run, the variable of per capita GDP, per capita motor vehicles and the number of displaced passengers through road transport had a significant and positive effect on road accidents, and the squared per capita GDP had a significant and negative impact on road accidents. Additionally, the results showed that Kuznets hypothesis was true between per capita GDP and road accidents.
An economic review on Iran’s traffic fatalities:
Nader Mehregan et al. (2012): In this study, some economic factors affecting road accidents in the context of Kuznets bio-environmental hypothesis (EKC) have been investigated. The analysis of these factors and their relationship with road accidents has been done in the form of ordinary least squares econometric (OLS) for the time period between (1971 - 2009). In fact, the survey has been conducted using the data of a period of 39 years. The results of the study have shown an inverted U-shaped Kuznets relationship between traffic losses and GDP per capita; and a negative relationship between the variable of investment in transportation infrastructures, improved medical care; and a negative relationship between the variable of investment in transportation infrastructures, improving medical care, and cultural indicators with traffic fatalities, and a direct relationship between the number of per capita vehicles with the rate of road fatalities.
The relationship between road fatalities and economic growth:
In this study, Law et al. (2010) examined the Kuznets relationship between road fatalities and economic growth. The data used in this analysis included a sample of 60 countries at different levels of economic growth over the period of 1972 to 2004; and the sample formed an unbalanced panel of 1411 annual observations because of the unavailability of some data. The statistical analysis of the sample was divided into two groups, consisting of the highly developed countries (with a human development index higher than 86% in the year 2007) and the less developed countries.
The experimental model used in this study is as follows:
lnλit=ai+lnpopit+β1time+β2lnGDPit+β3lnGDPit2+β4Ιit+β5Mit+ β6Xit+εit
Where λ_it is the number of road fatalities for the country of in the period of t, GDP is per capita gross domestic product, POP; population (thousand). Iit is a structural variable, Mit is the variable of technology and medical care, Xit is other control variables, β I is the model parameters, αi is a country-specific coefficient, Time is a time trend, and ε itis an error statement.
The results indicate that there is a Kuznets relationship between a high level of confidence for the two groups of highly developed and less developed countries, and in fact, they show that there is a U-shaped relationship between road fatalities and per capita income.
The Relationship between Road Accidents and Economic Growth in China:
Kaziuki Iwata (2010): In this study, the relationship between road accidents and economic growth has been examined using inter-provincial panel data. The survey was conducted for the years 1996 to 2008, and the number of the investigated provinces was 30. The results indicate that there is an inverse relationship between losses and GDP per capita and an increase in per capita GDP up to between $ 1500 to $ 4000 has led to the increase in the losses due to accidents, but an increase of more than $ 4000 in per capita GDP reduces deaths due to accidents.
The impact of economic development on road transport-related deaths among different types of road users
Paulozzi et al., (2007): In this paper, they studied the impact of economic growth on the fatality rate and traffic injuries among different types of road users (pedestrians, cyclists, motorcyclists, car travelers and other vehicles). Using linear regression analysis, this study examines the cross-sectional data on deaths caused by 44 countries in the year 2005.
The survey results for two stages of economic development indicate that in the first phase of development, we face an increase in the accident death rate until we reach a critical point and then, we will observe the decline of this rate. They attributed the initial increase and then the decrease in the death rate to changes in the rate of non-motorized road users (pedestrians and other vulnerable road users). However, changes in the mortality rate at higher levels of income were unclear.
The study population and sample
The statistical population in this study is the total road casualties of Iran and the study period is from 1986 to 2016 in a time series, and in addition, the combined statistical method of the statistical population from 2001 to 2016 was used as a panel for all provinces of the country.
Statistical and econometric method used:
The conventional OLS method is used to explain the effects of economic variables affecting road accidents; then in order to ensure the accuracy of the results of the research on the effect of these variables, the study is conducted by the panel data method using the data of Iranian provinces.
Estimated patterns in the OLS and panel data methods
According to the theoretical foundations and empirical studies mentioned in the second chapter of this study, the mathematical model analyzed in this study, road losses are expressed as a function of the variables affecting it:
R
TA=f(GDP,V,M,I,POP,TRN,EDU)
Where:
RTA: Indicates the number of people killed and injured in road accidents (per person).
GDP: shows GDP (in billion Rials)
V: shows the number of vehicles including all types of motor vehicles (by device)
M: Indicates the health care index based on the number of physicians
I: represents the index of investment on infrastructure (in millions of Rials) which is calculated based on the investment expenditure on road infrastructure.
POP: represents the population (in thousands)
TRN: shows the types of suburban roads (in kilometers).
EDU: indicates the literacy rate.
In compiling the estimated model of this study using the theoretical foundations as well as the usual models used in previous empirical studies, it has been attempted to adopt a model based on the Kuznets bio-environmental hypothesis that best describes the relationships between variables. Therefore, in estimating the model by OLS we have:
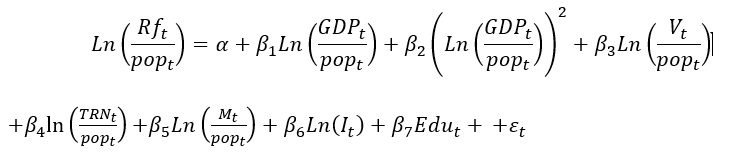
 :Per capita death from traffic accidents per every thousand persons in the population
 : per capita GDP (billion Rials) based on the cost of the base year of 2004
 : per capita motor vehicles per every thousand persons
It : investment on transportation Infrastructure (Billion Rials) based on the cost of the base year of 2004
 : the number of doctors per every thousand people
Edut: the percentage of literate people
popt: Country Population
TRNt: the amount of road network (suburban roads based on kilometers)
εt  is part of the regression error and t is the time.
However, it should be noted that due to the lack of appropriate provincial data as an indicator to investigate the effects, the medical care variables and the level of culture on the model of these variables have not been investigated in the panel method. Therefore, the model examined in the panel method is as follows:
LnRfitpopit=αi+βi1LnGDPitpopit+βi2LnGDPitpopit2+βi3LnVitpopit
βi4lnTRNtpopt+βi5LnIit+εit [3-22]
i : is the cross section (provinces).
Investigating the stability of variables
Table 1. Investigating the stability of variables
|
Variables |
T statistics Dickey Fuller test |
Variables |
T statistics Generalized Dickey Fuller test |
Results |
|
lnRTA/POP |
18/2- |
lnRTA/POP |
16/0- |
stable with a difference |
|
|
**66/3- |
|
***63/3- |
|
|
lnGDP/POP |
03/2- |
lnGDPPOP |
14/0- |
stable with a difference |
|
|
***30/5- |
|
***36 /5- |
|
|
lnV/POP |
09/1- |
lnVPOP |
85/0- |
stable with a difference |
|
|
***68/4- |
|
***47/4- |
|
|
lnI |
32/1- |
lnI |
26/0- |
stable with a difference |
|
|
***66/4- |
|
***40/4- |
|
|
lnM/POP |
***84/3- |
lnMPOP |
50/2- |
stable with a difference |
|
|
***73/5- |
**95/3- |
|
|
|
lnTRN/POP |
***20/6- |
lnTRNPOP |
***37/6- |
stable at the surface |
|
lnEDU |
***54/4- |
lnEDU |
**61/3- |
stable at the surface |
*,**,*** indicates the significance levels of 10%, 5% and 1%; respectively.
Source: Research findings
The stability results by Dickey Fuller (DF) and Generalized Dickey Fuller (ADF) methods indicate the stability of the variable of road length (lnTRN / POP) and the level of education (lnEDU) at the surface, and other variables with a one-time difference.
Co-integration test
Table 2. Co-integration test results with Dickey Fuller and generalized Dickey Fuller methods
|
Variable |
Dickey Fuller t statistic |
variable |
Generalized Dickey Fuller t statistic |
result |
|
Error component |
***49/5- |
Error component |
55/5-*** |
Stable at the surface |
*,**,*** indicates the significance levels of 10%, 5% and 1%; respectively.
Source: Research findings
The results of the co-integration test show that the model variables are co-integrated, thus there is a long-run equilibrium relationship between the variables.
Estimation of the country pattern by the time series method
To estimate the country pattern of the research, the OLS ordinary least squares time series data method is used. The results of the country pattern estimation are presented below:
Table 3. Estimation of the results of the first research model
|
Variables |
Coefficient |
t- statistic |
probability |
|
C |
-9.612755 |
-2.908010 |
0.0082 |
|
LNGDP/POP |
7.120518 |
2.840184 |
0.0095 |
|
LNGDP/POP^2 |
-1.282912 |
-3.354831 |
0.0029 |
|
LNV/POP |
0.133862 |
24.04171 |
0.0000 |
|
LNI |
0.245780- |
8.170113- |
0.0000 |
|
LNM/POP |
1.655650- |
12.00592- |
0.0000 |
|
LNTRN/POP |
2.770864 |
80.49997 |
0.0000 |
|
LNEDU |
0.028437- |
77.83887- |
0.0000 |
|
Trend |
-0.266257 |
-25.76241 |
0.0000 |
R-squared = 91/0; Adjusted R-squared = 88/0; Durbin Watson = 88/1; Prob (F-statistic) = 0000/0
Source: Research findings
The table above represents that because F statistic has probability less than the significance level of 5%, the significance of the whole regression model is confirmed. In addition to the above results, R2 coefficient shows that about 91% of the dependent variable variations are explained by the independent variables of the research, indicating the high explanatory power. Also, Durbin-Watson statistic value is 1.88 indicating the absence of strong correlation between the research variables.
In summary, the results of the estimation of time series model represent that:
Normality test:
The results of the normality test for the country pattern of the research are presented in the following table:
Table 4. The results of country pattern normality test
|
Normality test |
Jarque–Bera statistic |
Probability |
|
|
1.58 |
0.4524 |
Source: Research findings
In the normality test, the null hypothesis states that the remaining components of the regression model is normal. Considering that the Jarque–Bera statistic is 1.58 with a probability of 0.4524, it indicates the null hypothesis that the remaining components of the regression model are normal, is confirmed.
Anisotropy variance test:
The results of the anisotropy variance test are presented in the following table:
Table 5. The results of the anisotropy variance test
|
Test |
F statistic |
probability |
|
Breusch–Pagan test |
70/0 |
6645/0 |
|
Galtscher |
48/0 |
8370/0 |
Source: Research findings
In the anisotropy variance test, the null hypothesis states that the remaining components of the regression model lack the anisotropy variance problem. Considering that the Breusch–Pagan Godfrey and Galtscher's statistics have values of 0.70 and 0.48, with probabilities of 0.6645 and 0.8370, respectively; it is shown that the hypothesis that there is no significant anisotropy variance for the remaining components of the regression model, is confirmed.
The Estimation of Provincial Pattern by Panel Data Method
F-Limer test:
Table 6. The results of F-Limer test
|
F-Limer test |
Statistic |
Probability |
|
|
27.43 |
0.0000 |
Source: Research findings
The F-Limer statistic shows 27.43 with a probability of 0.0000 which indicates the confirmation of the panel data method and is therefore acceptable regarding this statistic and panel data method test.
Hausman test:
The Hausman test has been used to decide whether to use fixed effects or random effects method.
Table 7: The results of Hausman test
|
Hausman test |
Statistic |
Probability |
|
|
121.23 |
0.0000 |
Source: Research findings
The Hausman test number is 121.23 with a probability of 0.0000 indicating the confirmation of the fixed effects method.
The Estimation of Provincial Pattern:
Table 8. Results of Estimation of Provincial Pattern
|
Variables |
Coefficient |
t-statistic |
Probability |
|
C |
-1.153751 |
-8.290159 |
0.0000 |
|
LNGDP/POP |
0.526040 |
7.462302 |
0.0000 |
|
LNGDP/POP^2 |
-0.037605 |
-2.215771 |
0.0272 |
|
LNV/POP |
0.540883 |
23.28300 |
0.0000 |
|
LNI |
-0.223004 |
6.729436- |
0.0000 |
|
LNTRN/POP |
0.061437 |
2.788776 |
0.0055 |
R-squared = 87/0; Adjusted R-squared = 86/0; Durbin Watson = 74/1; Prob (F-statistic) = 0000/0
Source: Research findings
The results of the estimation of the provincial pattern show that:
The Normality Test:
The results of the normality test of the provincial pattern of research have been presented in the following table:
Table 9. Results of the normality test of the provincial pattern
|
Normality Test |
Jarque–Bera statistic |
Probability |
|
|
3.46 |
0.1772 |
Source: Research findings
Considering that the Jarque–Bera statistic is 3.46 with a probability of 0.1772, it is indicated the null hypothesis that the remaining components of the regression model are normal, is confirmed.
Summary and Result of the Research
Findings related to the estimation of the country and provincial patterns show that there is a positive significant relationship between GDP and road losses, and a negative and significant relationship between the square of GDP and road losses, traffic losses in the range of income growth will have a positive relationship, and when they reach a threshold level of income, they will start their negative relationship. Simply put, there is an inverted U-shaped relationship between income and traffic loss, and Kuznets Bio-Environmental hypothesis has came true for Iran regarding traffic fatalities. Thus, it can be concluded that there is a significant inverted U-shaped relationship between economic growth and road fatalities in Iran. Also, the results of estimating the country and the provincial patterns show that in the provincial model, the variable of the number of cars and in the country pattern, the variable of GDP have the most effects on accidents.
References
Al Omran, R., Al Omran, S. A., (2015), Investigating the Long-Term Relationship between Road Accidents and Factors Affecting it, Rahvar Research Studies, 1(12), 33 – 54.
Iwata, K. (2010). The relationship between traffic accidents and economic growth in China. Economics Bulletin, 30(4), 3306-3314.
Jamali, J. (2015). Identification and ranking of factors affecting traffic accidents in Bushehr province. Res Stud Rahvar, 3(10), 79-101.
Law, T. H., Noland, R. B., & Evans, A. W. (2011). The sources of the Kuznets relationship between road fatalities and economic growth. Journal of Transport Geography, 19(2), 355-365.
Law, T.H., Robert B. Noland, Andrew W. Evans, (2010), The sources of the Kuznets relationship between road fatalities and economic growth, Journal of Transport Geography, journal homepage: www.elsevier.com/locate/jtrangeo, 5/19/2010.
Mehregan, N., Gholizadeh, A. A., & Mohammadi, F. (2012). Iranian traffic fatalities in the context of an economic survey. Transportation Engineering, 4(1), 69-59.
Paulozzi, L. J., Ryan, G. W., Espitia-Hardeman, V. E., & Xi, Y. (2007). Economic development's effect on road transport-related mortality among different types of road users: a cross-sectional international study. Accident Analysis & Prevention, 39(3), 606-617.